US CPI Numbers & New Opportunities
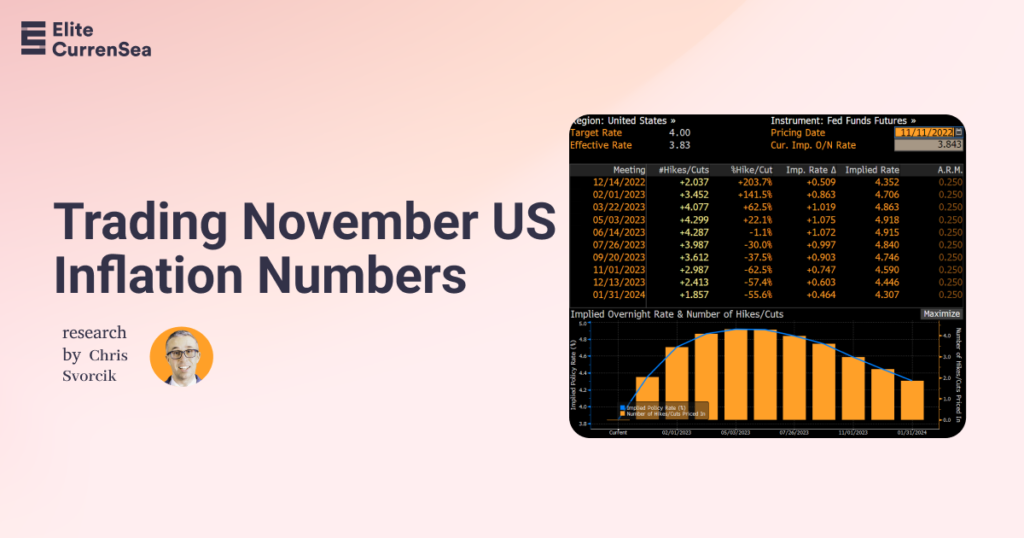
How Interpreting US Inflation Numbers Helps You to Gauge The Prospects of US Recession
Stocks soared after a weaker-than-expected CPI reading, as inflation remains a top concern for Fed officials and market participants.
There’s no doubt that CPI has been a major factor in driving global narratives around restrictive central bank policy. This has led to a selloff in growth stocks and renewed interest in value companies.
However, we’re not out of the woods yet, and investors remain cautious about taking on too much risk. In the meantime, I’ll take a break from reading about how a certain young entrepreneur just disrupted a significant industry.
Why CPI Matters (so much)?
Instead of talking about the economy, let’s discuss what happened with the CPI print and how to think about the market going forward.
A strong labour market has put much more relative importance on inflationary readings, even though we know that the [organization] has a dual mandate to also look at employment figures.
The market tries to predict upcoming data by using the term “priced in.” This means that expected figures are formed. For example, around 50 economists with good track records predict inflation for a particular month through a survey. The average of this survey is the expected rate of inflation.
The most important implication of a “higher for longer inflation” figure is how the Fed will react. This is because a higher inflation rate will give the Fed permission to increase interest rates, which is bad for longer-duration assets such as the speculative technology basket, as well as for risk assets more broadly.
On CPI print days, the most important thing is the new information that the market receives. This is why the print vs. expectations is the most important figure. Here is a heatmap since the beginning of 2021 in terms of expectations vs. actuals with green indicating lower-than-expected inflation and red indicating higher-than-expected inflation:
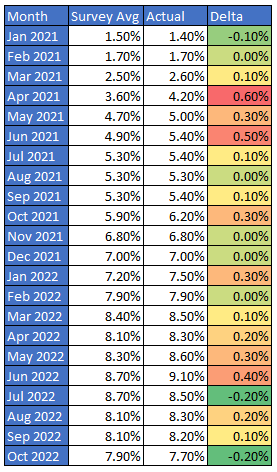
As you can see, there have only been a handful of instances since the beginning of 2021 in which the actual inflation reading has come in below expectations. This print was one of them.
Fed’s Messaging
The Fed’s decision at the November meeting was dictated by the CPI number. They hiked rates 75bps, bumping up the target range to 3.75 – 4.0%.
The FOMC opened the door to slowing the pace of hikes at the upcoming December meeting but also signaled that they are not close to pausing the ongoing tightening cycle.
The market is widely anticipating the forward meetings to hike 50bps in December and another 25bps in the first meeting of the new year. The question on the top of everyone’s mind is – what will the Fed do after these two hikes?
Chair Powell stated that rates are likely to move higher than previously indicated by the September dots (4.75%) and, more importantly, remain there for longer than previously expected.
Powell acknowledged that the chances of a soft landing have decreased. The hawkish tone is consistent with a macroeconomy that continues to experience repeated upside surprises to inflation and labor markets.
Going into CPI, it was a common view that the Fed would need to see sufficient progress on inflation in order to pause at 4.75% in February. However, the risks are now skewed towards more hikes, which could bring about a recession sometime later in 2023 or early 2024.
CPI Report Sub-Sections Breakdown
Now that we know what the expectations were vs. the actuals, let’s break it down by subsector…
Headline CPI:
- YoY consensus was 7.9% & the actual was 7.7%
- MoM consensus was 0.6% & the actual was 0.4%
Core CPI (Headline ex-food and energy):
- YoY consensus was 6.5% & the actual was 6.3%
- MoM consensus was 0.5% & the actual was 0.3%
There are two key takeaways here:
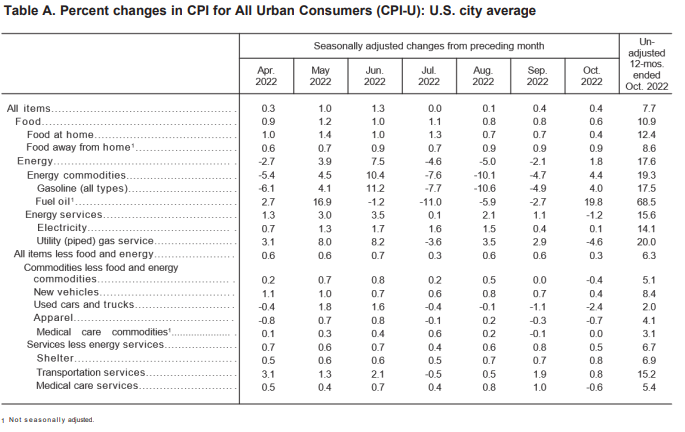
- Rent (and shelter more broadly) continued to stay strong. The shelter aggregate rose 0.8% in October, with tenants’ rent up 0.7%, owners’ equivalent rent up 0.6%, and lodging prices increasing 4.9%. This could continue into next year, as the CPI’s rent measures sometimes lag behind actual industry figures. However, when we’re in a period of historically high mortgage rates, we know that the index will eventually catch up to reality.
- The core index excluding shelter declined by 0.1%, one of the softer monthly changes for this aggregate reported in recent decades. Core goods prices were particularly soft, with a 0.4% decline reported for October. It looks like some of the factors that had been boosting inflation over the past year have started to either downshift or reverse. Vehicle prices and medical care services prices are two areas that have experienced significant pressure. However, increased vehicle supply has helped ease these pressures lately. According to the CPI, prices for new and used vehicles declined 0.9% in October after a 0.8% average monthly increase over the prior twelve months.
The source data used to estimate health insurance prices was updated, which led the CPI for medical care to be down 0.5% in October. This is after the aggregate increased by 0.5% per month over the prior year.
Rapid Drop in 10yr Yields
The US 10yr yield fell sharply last week, from 4.2% to 3.8%. This was one of the biggest moves in the market. Growth continued to rally on Friday, and the dollar fell further, but the bond market was closed due to Veterans Day. Keep a close eye on the bond market when it opens on Monday.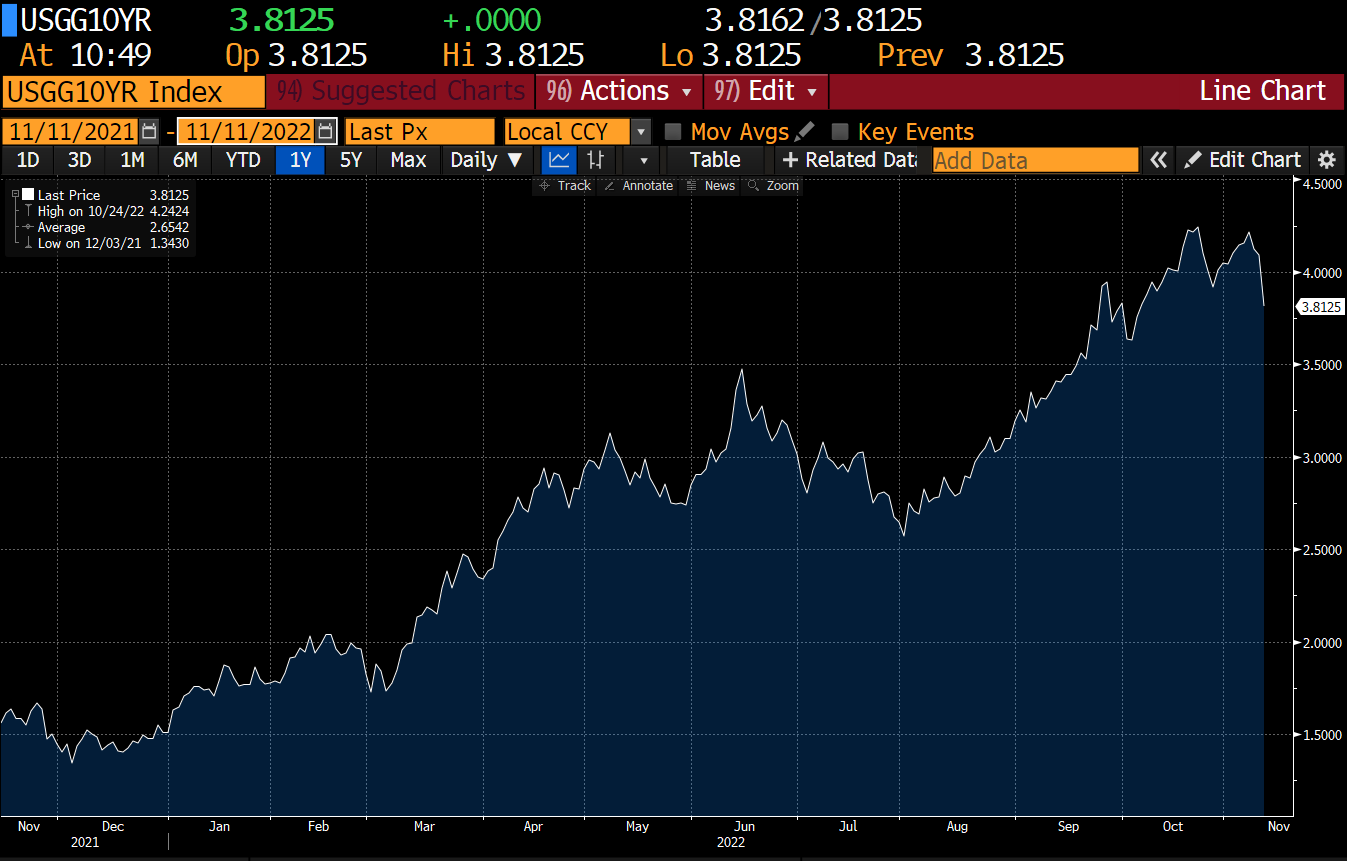
High-growth technology stocks have been hammered by elevated yields as the longest-duration part of the risky equity market. It’s no wonder the NASDAQ 100 had its best one-day performance since March 2020, up 7.5% in one session.
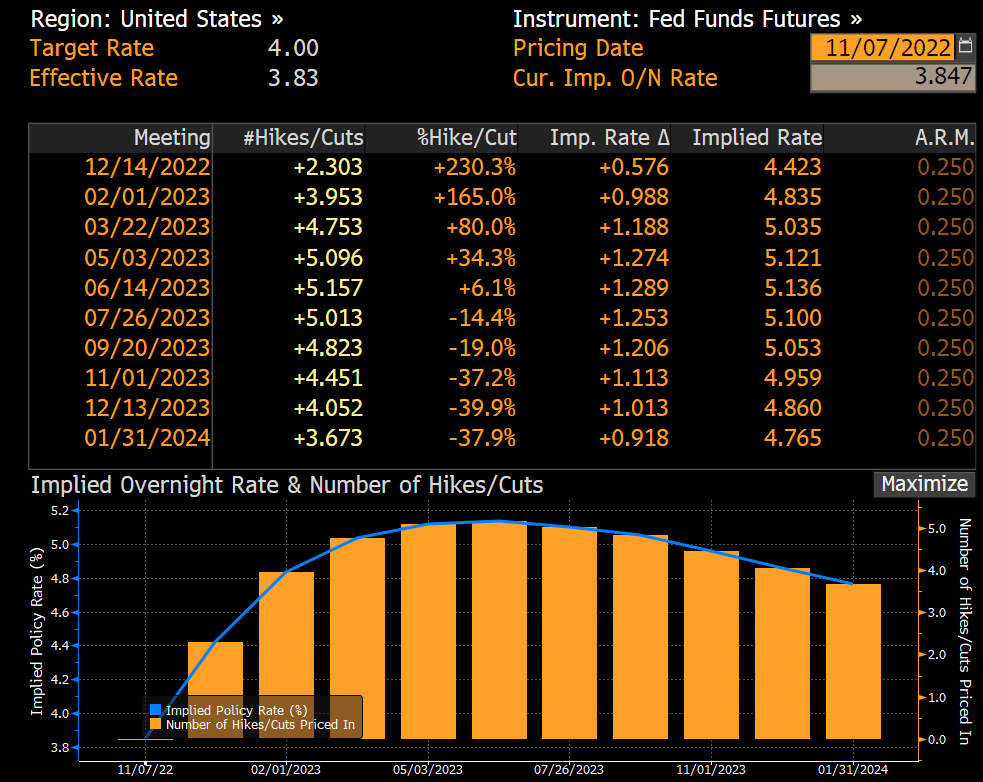
Next Two FOMC Predictions
The consensus view among analysts is that the Fed is likely to raise rates by 50bps at its next meeting, but this is now essentially a lock. Where this starts to get interesting is looking further out on the hiking curve. Here is the shape of the curve of expectations as of Monday:
Before:
After:
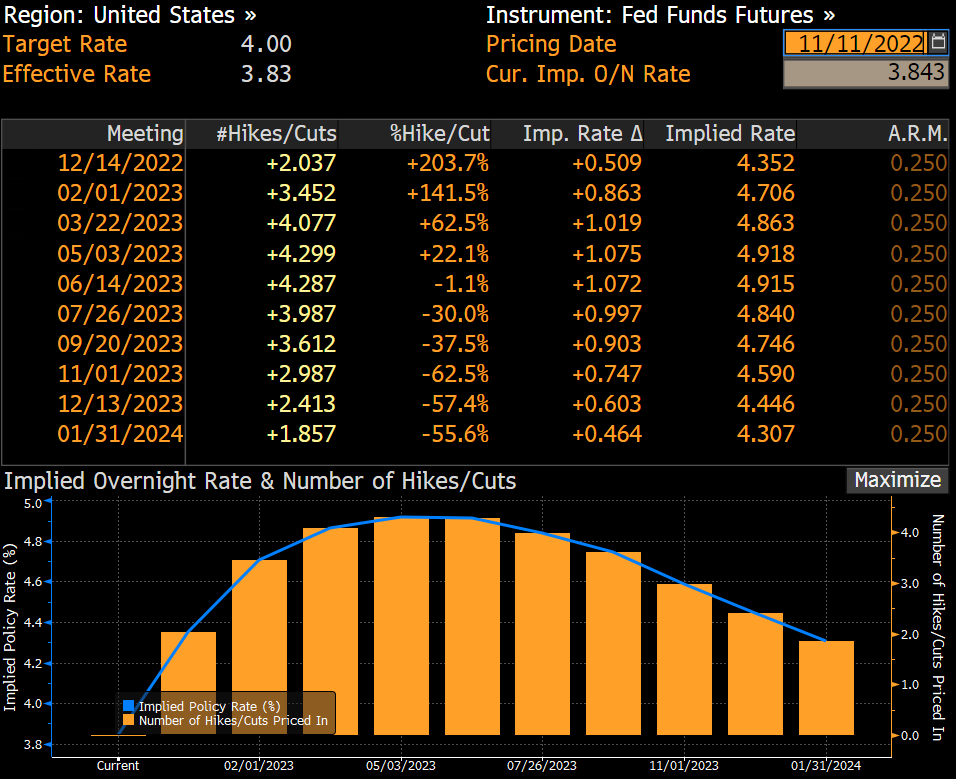
This curve indicates what happens after the December hike – before the print, the odds were in favor of another 50bps hike, but now the market is pricing closer to a 25bps hike. The notable change also takes place around the end of the curve after the CPI print, which contradicts the “higher for longer” narrative and suggests that we may be closer to the end of the hiking cycle than previously thought.
How to Trade this Insight?
Really hard to tell, we’ve been saying for ages that the markets are generally bullish, but it’s crucial not to miss an opportunity to skim them good Equities and have your longer-term best in place (no sh*t Sherlock).
If weakening financial conditions, lower inflation, and a soft job market continue, it will validate the pivot narrative that some optimists expected in the last FOMC meeting, and we can see SP500 extending the leg up as well as the USD further weakening against the majors.
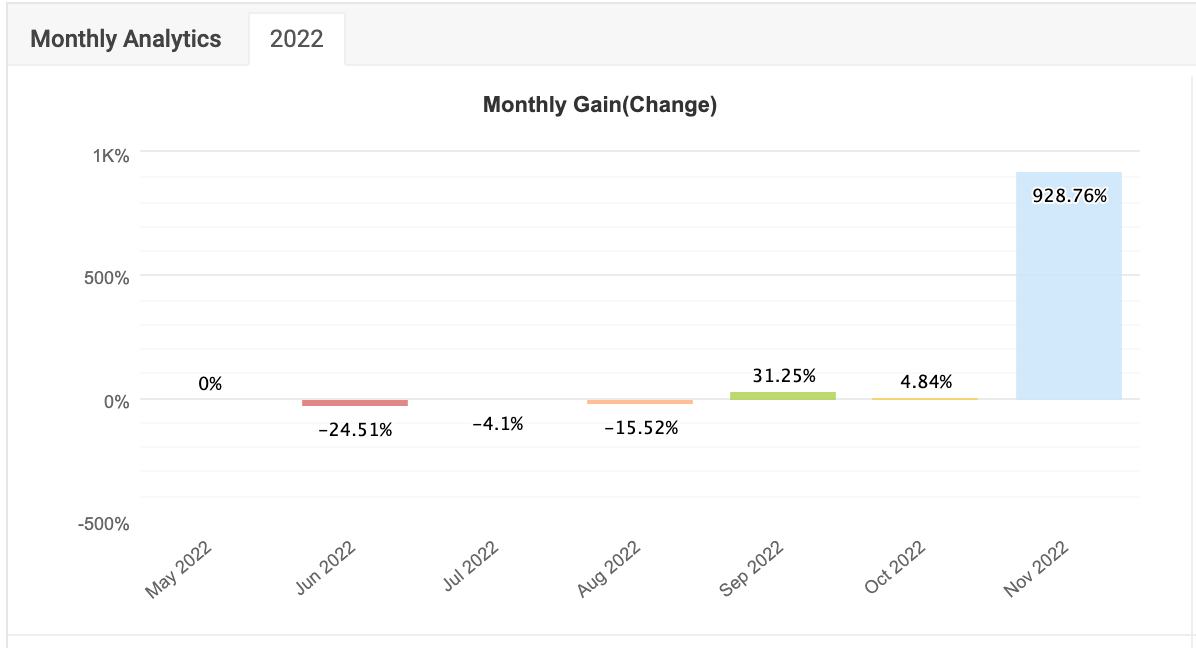
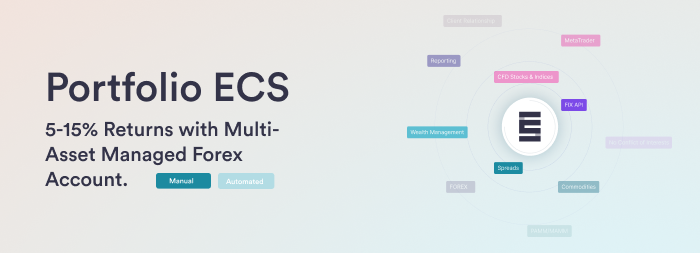
If our takes don’t help you skim much of the opportunities, consider checking out Portfolio ECS (flagship manual multi-asset), we managed to collect an extremely-dangerous-to-look-at-without-inflicting-hubris” 910% prior to CPI report.
Safe Trading
Team of Elite CurrenSea 🇺🇦❤️


Leave a Reply