Next Ten Years of S&P500 & Its Alternatives
If you’re considering trading/investing your saving in S&P 500 over the next ten years, expecting 16.6% yearly returns of the past decade, it’s important to have an idea of the range of returns you could potentially see going forward.
Luckily, there’s a framework that can help with that. So let’s take a look at this simple framework and what it tells you about what you might realistically expect…
Framework for Assessing SP500 Potential In a Nutshell
There are three main factors that affect long-term returns: the growth in earnings per share (EPS), the change in the price-to-earnings (P/E) valuation multiple, and the dividend yield. You can express this mathematically as:
Total S&P 500 return = (EPS growth * P/E multiple growth) + dividend yield
Since EPS growth equals sales per share growth multiplied by margin growth, and sales per share growth equals sales growth divided by change in the share count, you can break S&P 500 returns down into five components.
Total return = (Sales growth / share count growth ) margin growth P/E multiple growth + dividend yield
The framework is key. If you can estimate the potential ranges for each variable, you’ll have a pretty good idea of the returns you can expect over the next ten years.
You can also flip it on its head and use the combination of variables that would give you a particular return to decide how likely that is. But before we look at the future, we must first understand the past.
Growth Factors Behind 2012 – 2022 16.6% Average Yearly Growth
The S&P 500 had an amazing 16.6% return per year from 2012 to the beginning of this year. Chris Bloomstran, the chief investment officer of Semper Augustus Investments Group, calculated that the expansion of the P/E multiple was the single biggest driver of those returns, at 6% per year. Margin growth followed close behind at 3.9%, with sales growth at 3.5% and the dividend yield at 2.4%. The share count decreased due to buybacks, which added an additional 0.7%.
Over the past decade, the S&P 500 has achieved an impressive 16.6% return per year, one of its best runs on record. Together, the expansion in margins and valuations generated a healthy 10% return per year.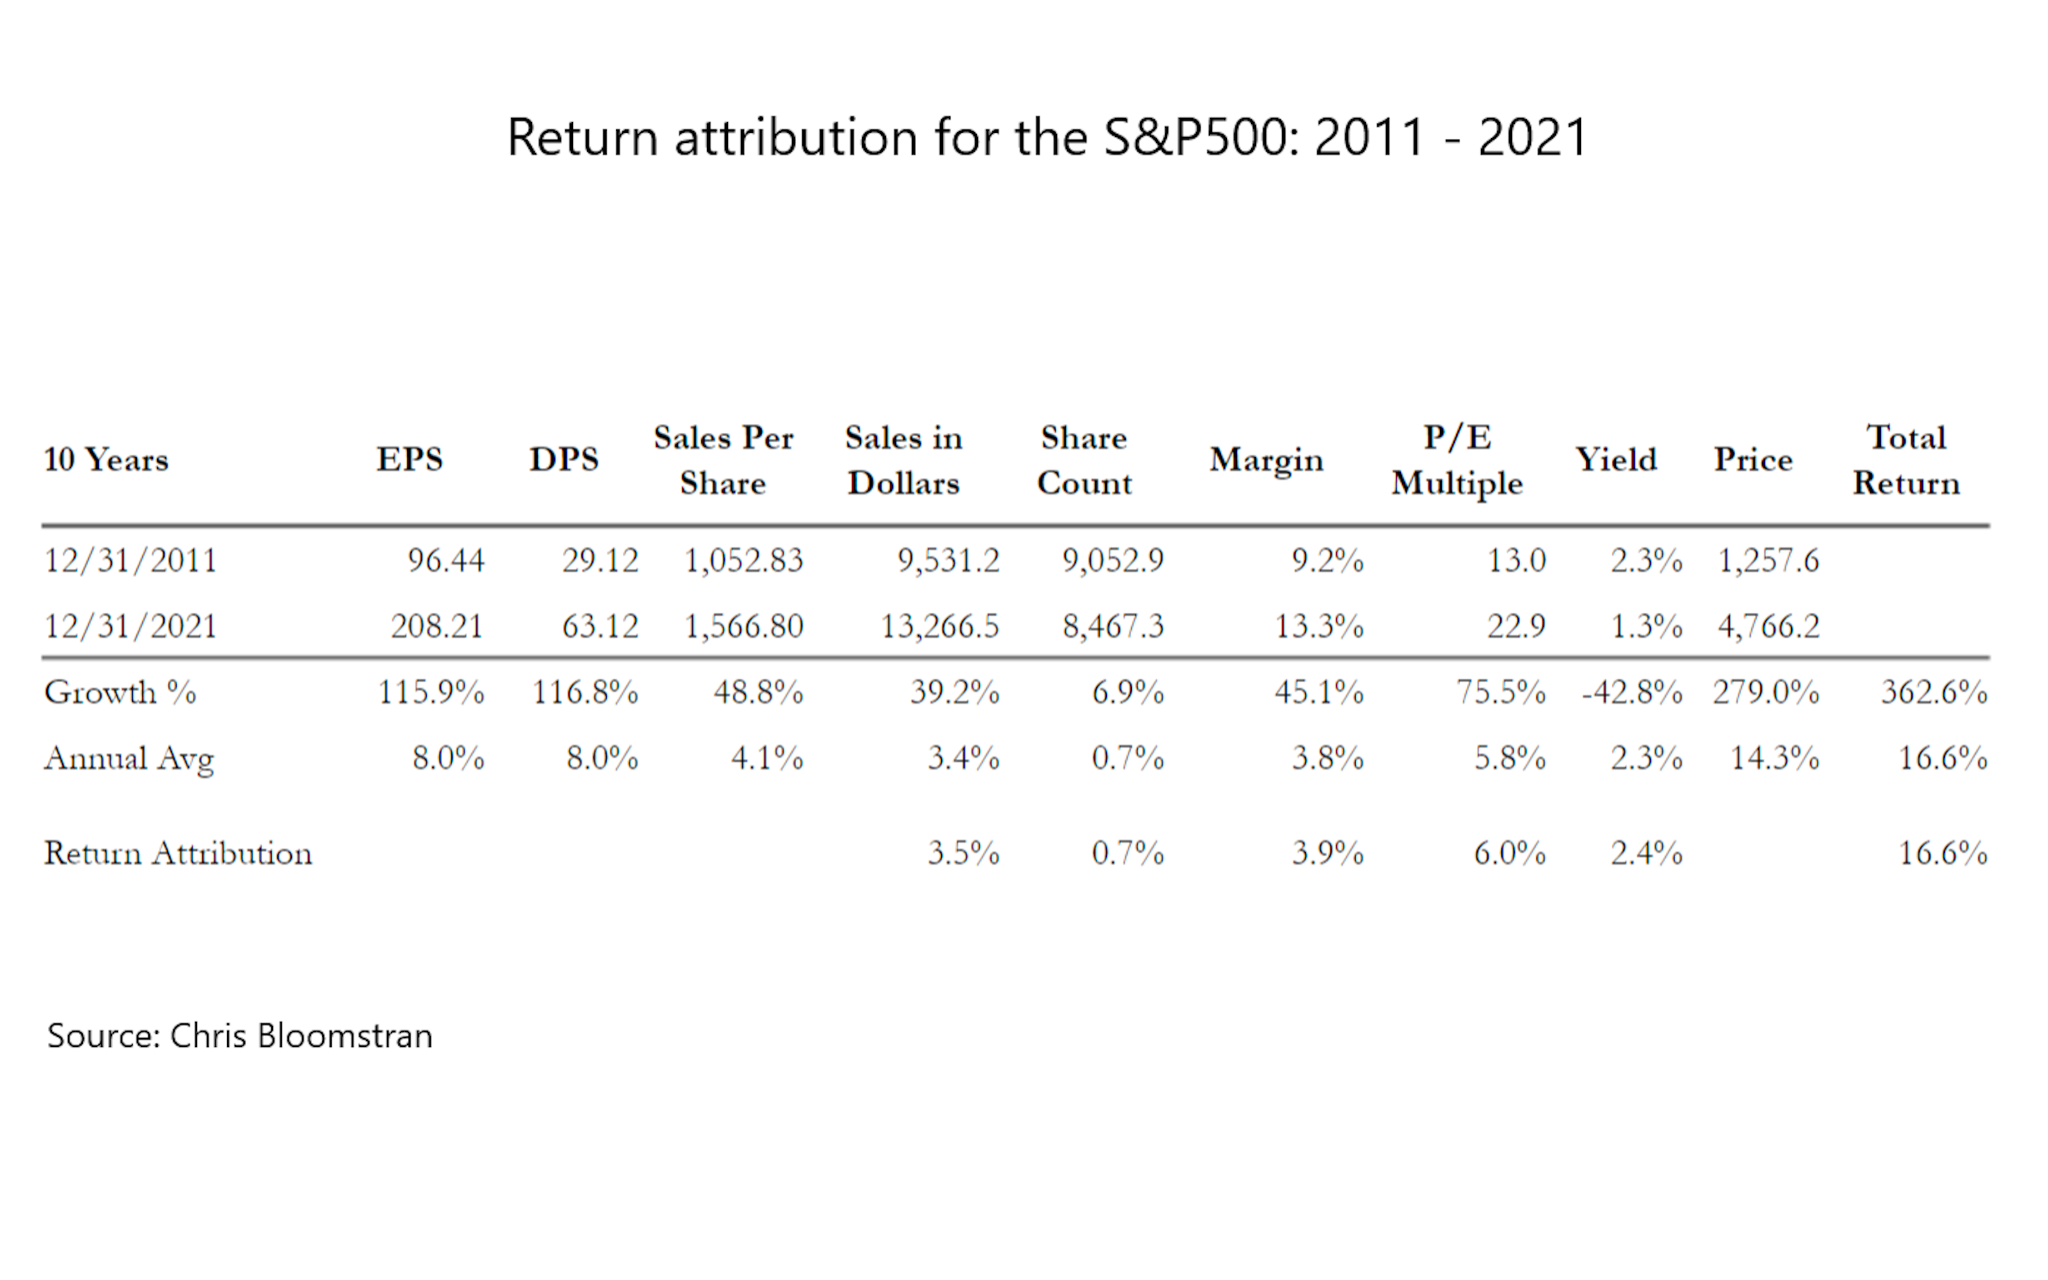
SP500 and 2022 – A Reality Check?
We’ve got a reality check. At the beginning of January, it looked like ten-year returns weren’t going to be very good. This is because margins and valuations were at record highs, so they weren’t going to drive as much return as they used to.
This left sales growth, buybacks, and dividend as the main drivers. But even if you were optimistic and expected sales growth of 4%, buybacks of 1%, and a dividend yield of 2% – all higher than history – the expected return at that point wouldn’t have gone much higher than 7% per year, which is less than half its average for the past decade.
As 2022 began, the Fed started to increase rates to fight inflation, which caused P/E ratios and margins to shrink. However, companies were still able to pass on these higher costs to customers, resulting in a 9% sales increase.
The share count also decreased, and the dividend yield increased to 1.9%. In other words, this year’s market decline was caused by a contraction in valuations, not by deteriorating fundamentals.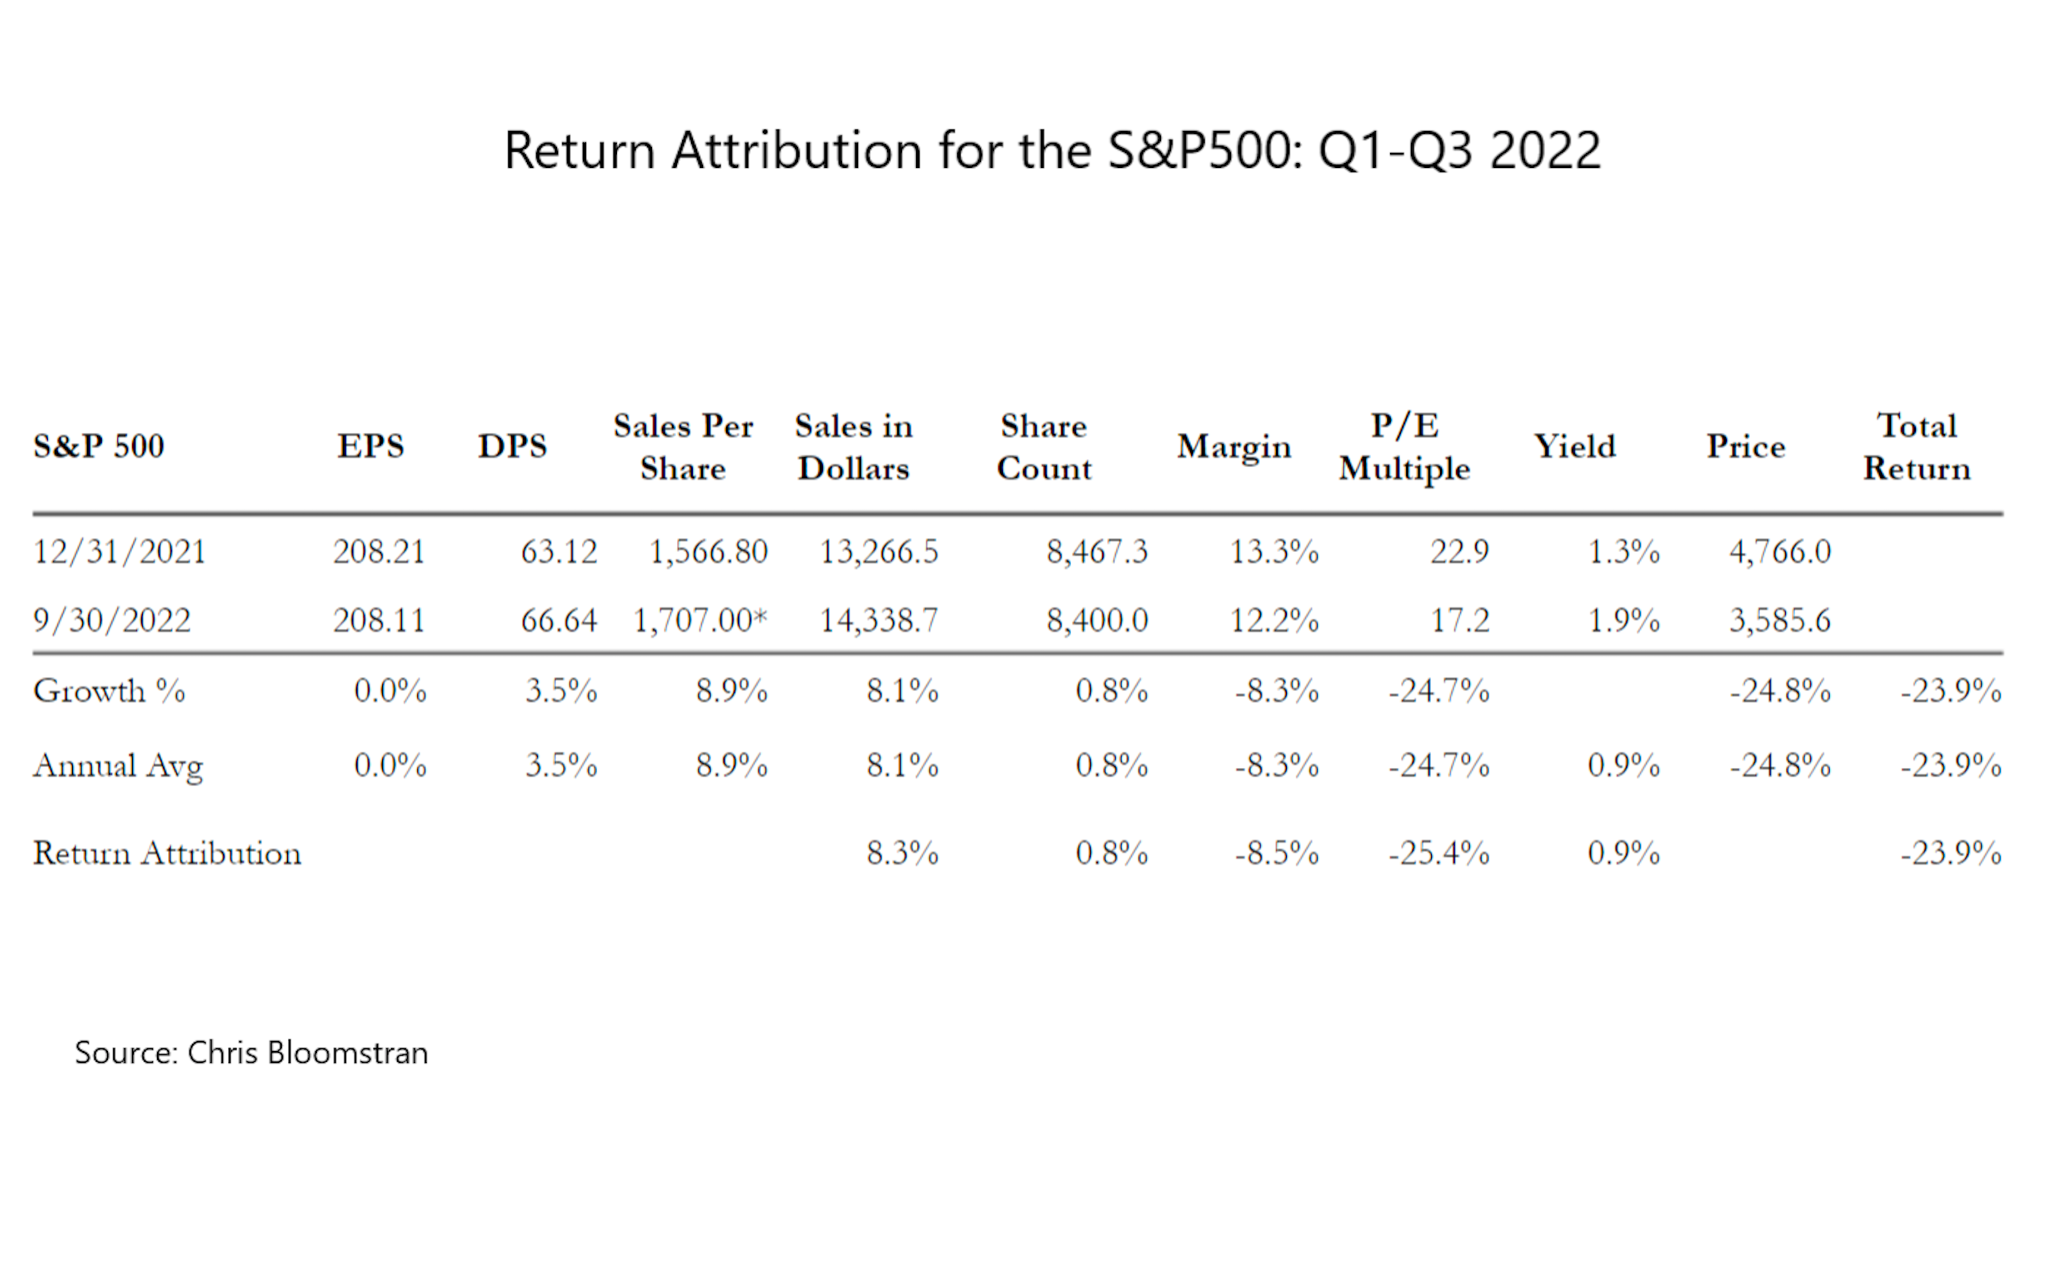
What Returns to Expect for SP500 Over The Next Decade?
Positively Optimistic – 10% Annually
To get an annualized return of 10%, you would need to either keep the dividend yield and buyback rate constant while sales growth goes back to its previous high, or you would need to see sales growth more than double while P/E multiples and margins stay at their current elevated levels.
While this is possible, it is quite optimistic and would require the macroeconomic environment to be very supportive, as it was over the past decade.
Even then, we don’t expect the levels to reach an average of 16.6% of the previous decade.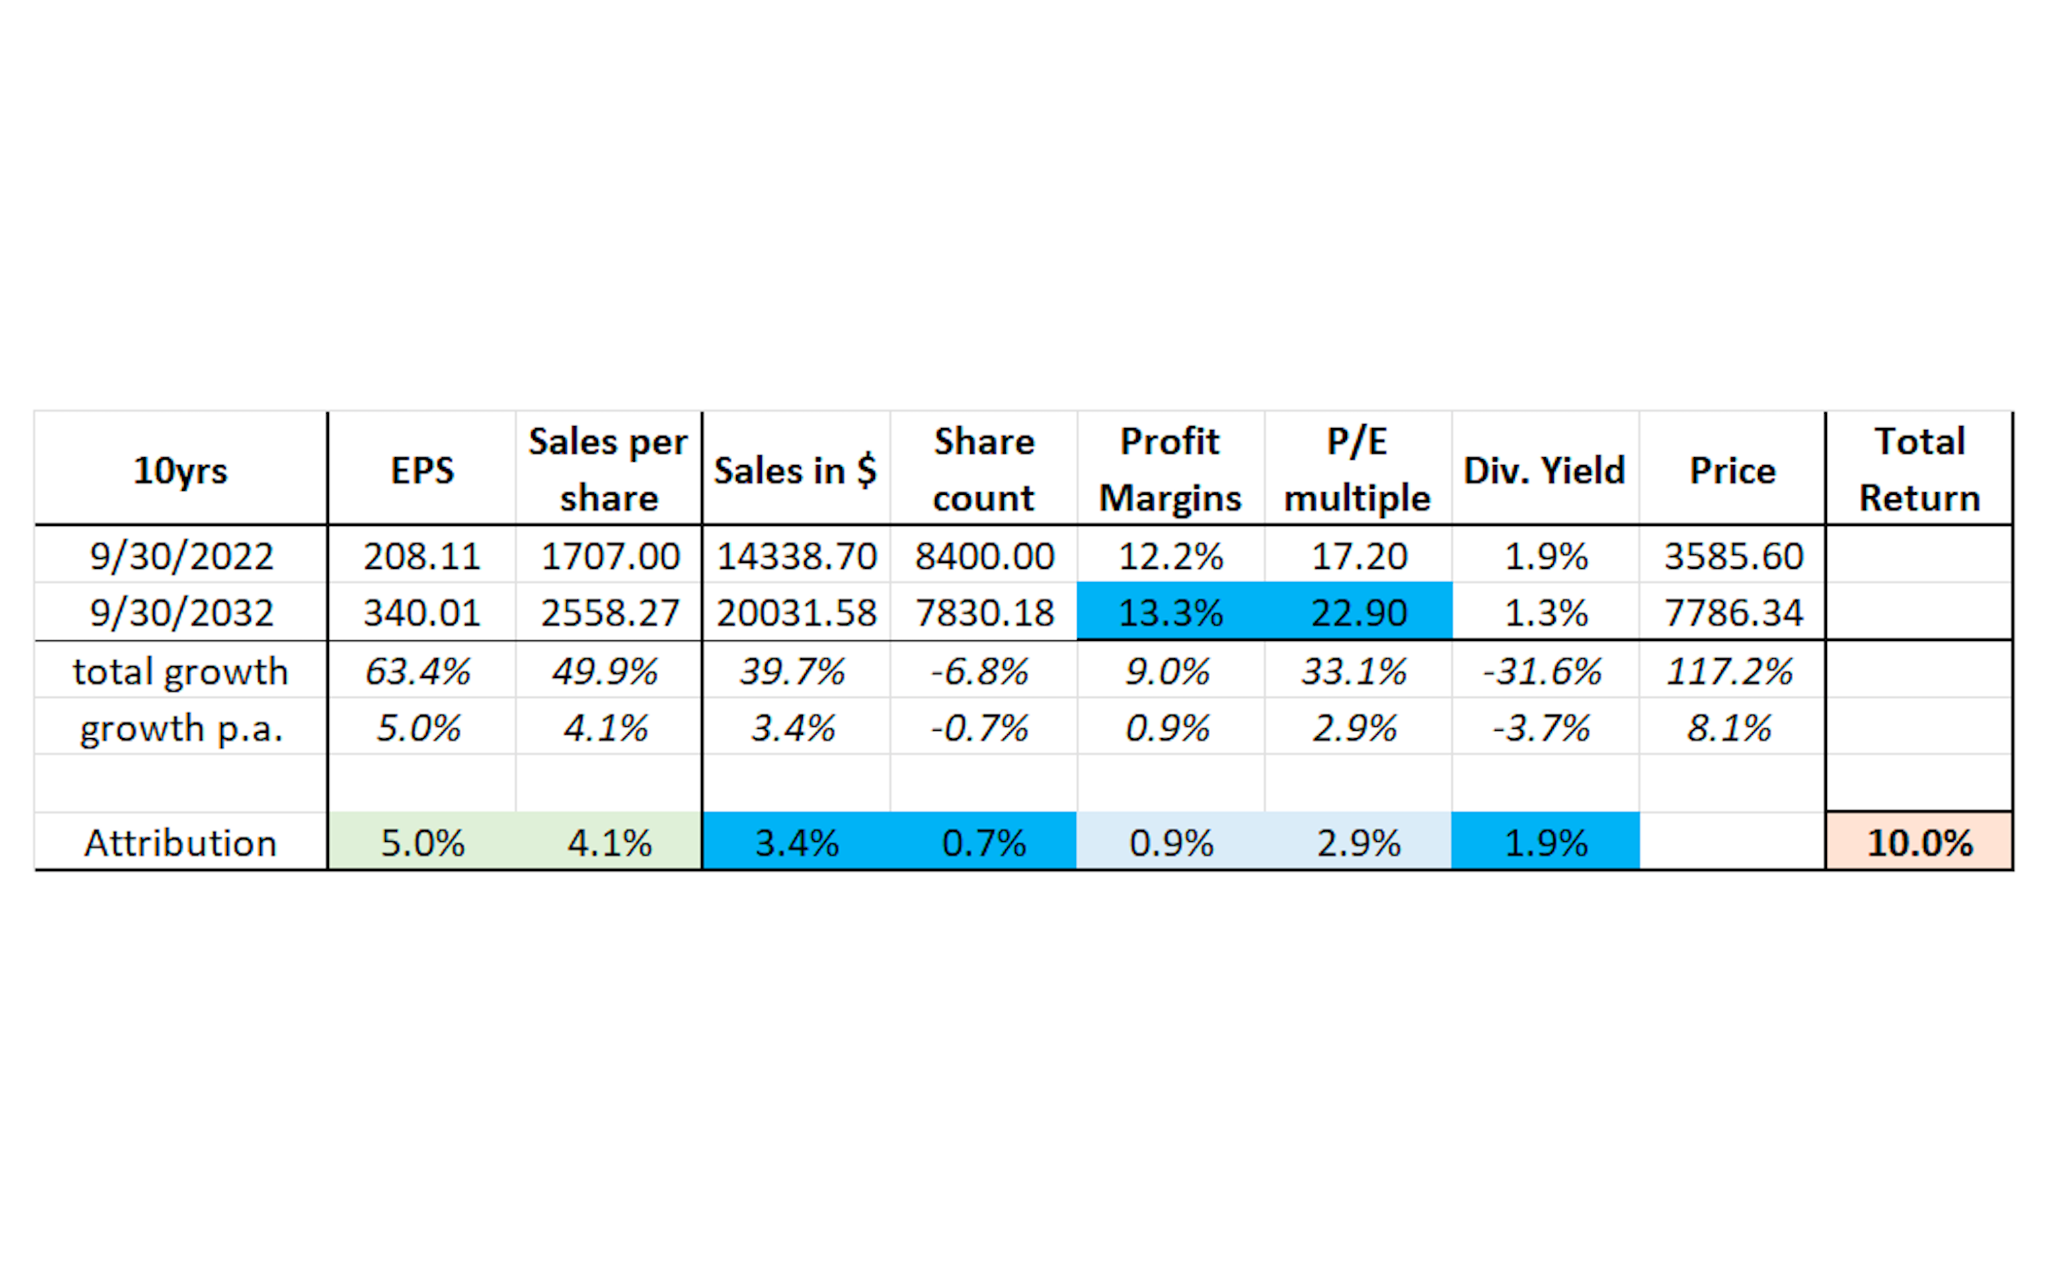
Optimistic – 6 to 7% Annually
Assuming current margins and P/E multiples, as well as growth rates in sales and buybacks, you can anticipate making about 6% per year in returns over the next decade. This might sound pessimistic, but it’s actually not.
First, margins and P/E multiples have historically been mean-reverting – in other words, they may stray from their usual levels, but they eventually snap back to them. Additionally, even if margins and P/E multiples don’t stay at their current levels, sales and buybacks can still grow at their historical rates, resulting in a cumulative return of 6%.
Second, the factors that drove them to new highs, such as tax cuts, falling interest rates, stable growth and inflation, and easy access to debt, are likely to be challenged over the coming decade. 
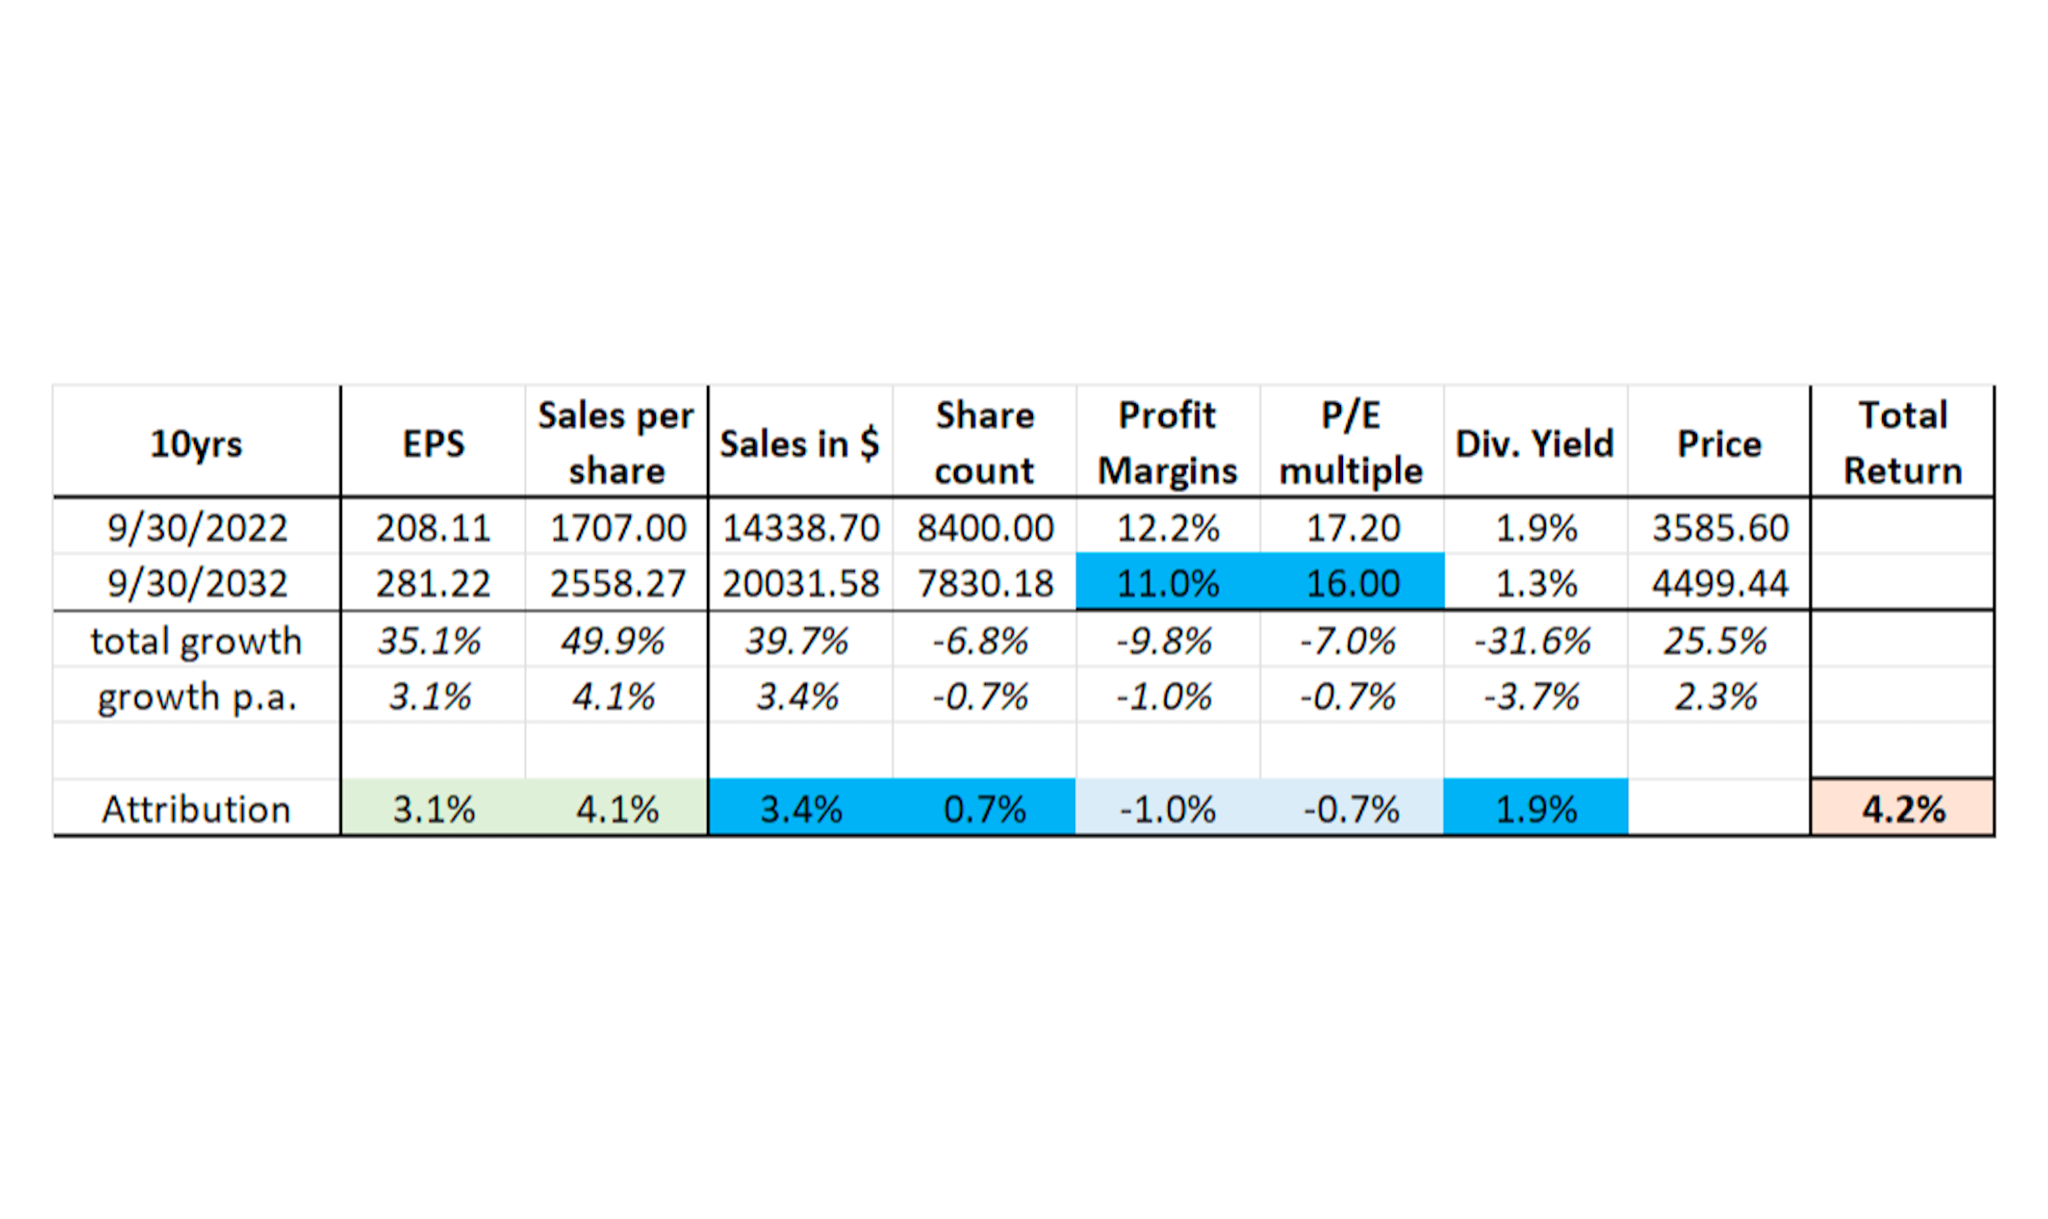
Neutral – 4% to 5% Annually
Assuming a less stable economic backdrop would bring multiples and margins closer to their recent averages (but still higher), you’d only be looking at making 4%-5% per year. This isn’t a pessimistic forecast: it assumes sales per share will grow at 4.8%, EPS at 3.8%, and the dividend yield will remain at 1.7%.
This rate of return is already much higher than the negative return you’d have expected at the beginning of the year using the same assumptions, but it’s arguably much lower than what most investors expect. This just goes to show how much timing can add to your long-term returns – if you get it right.
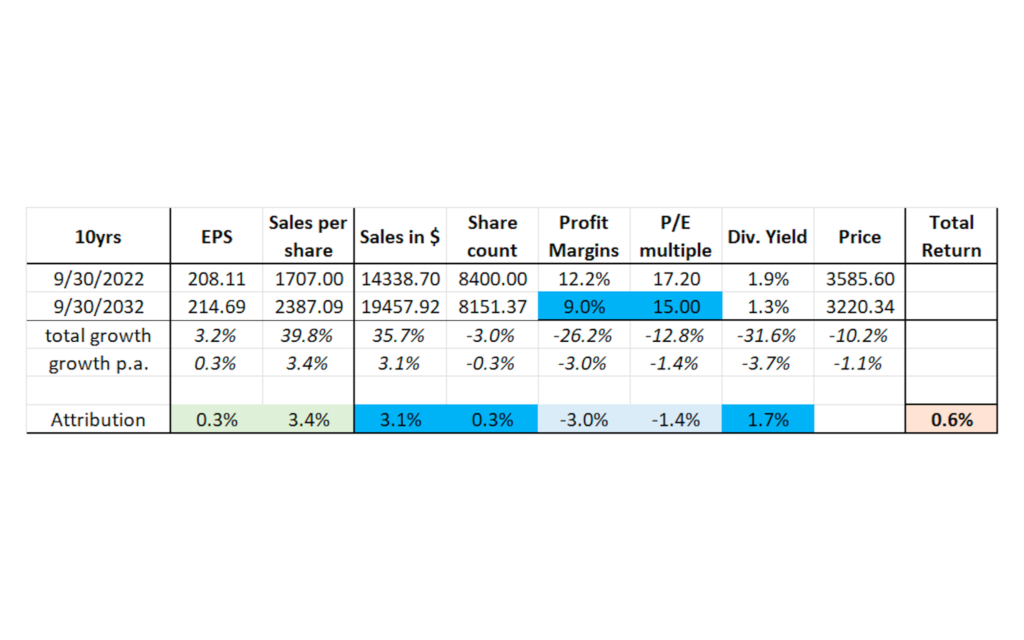
Pessimistic: 0% to 3% Annually
Thanks to this year’s contraction in valuations and margins, it’s less likely that we end the decade with zero returns.
But it’s not impossible. If the world is indeed entering into a more challenging period of higher inflation, higher interest rates, higher geopolitical risk, and higher government intervention, plus deleveraging and deglobalization, as many people expect, then margins and multiples could fall closer to their longer-term averages. If that happened, you could still get earnings growth of almost 2%, but your annualized returns would drop to below 3%. If sales or buybacks growth began to slow, you would make even less.
How to Speculate on These Assumptions?
Well, for once, and we will be lying if didn’t want you to rather invest in our trading, consider Portfolio ECS, unlike major Hedge Funds and Asset Management firms, as well as SP500 investment, the approach uses leverage, news trading with tight risk management (SL and TP) and has returned 8.5% per month (≈ 100% annually at under 15% DD💪) on average since we started in 2021 (already includes profit share fees).
While it’s a riskier investment and the history does not go back in the time of so long, it’s considered an alternative form of investment for a reason and does not require you to go all in.
Take a look at the offer page, it won’t hurt to see the information and decide for yourself. Unlike those other “alternative investment firms, we don’t nag our investors with calls 😊 (who calls people unannounced these days anyway..).
Alternatively, you can start picking your own trades in stocks and currencies, majors are acting out, and stock valuations are being rethought, generally, the volatility is on the rise – so there are heaps of opportunities, albeit with more risk going forward (but you know that already if you reading this).
Regardless of the approach you take, this framework could be valuable to you: by stress-testing your assumptions and gaining a better understanding of the fundamental drivers of stock returns, you’ll be in a good place to form a more informed forecast – one that takes you well beyond the old finger-in-the-air approach.
Safe Trading
Team of Elite CurrenSea 🇺🇦❤️


Leave a Reply