🔍 Netflix Bearish ABC Pullback Offers Discount in Uptrend 🔍
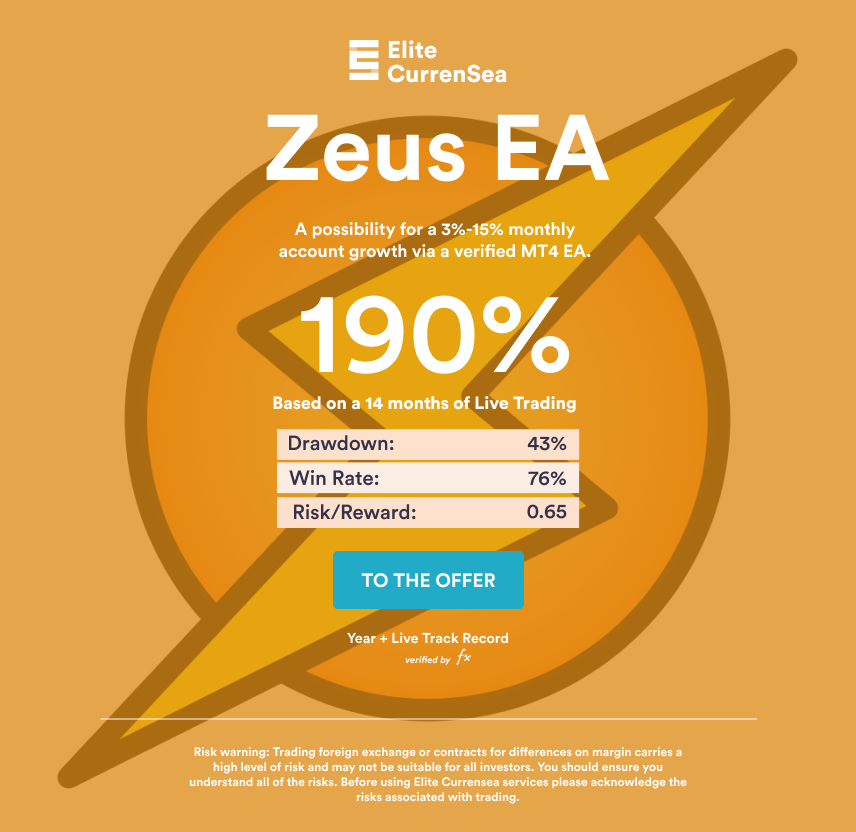
Dear traders,
some stocks are offering potential discounts within a large uptrend. For instance, Netflix (NFLX) is showing a bearish pullback after the price dropped about $85 (-15%) in recent trading. Could this be a support zone for price action and restart the uptrend?
Price Charts and Technical Analysis
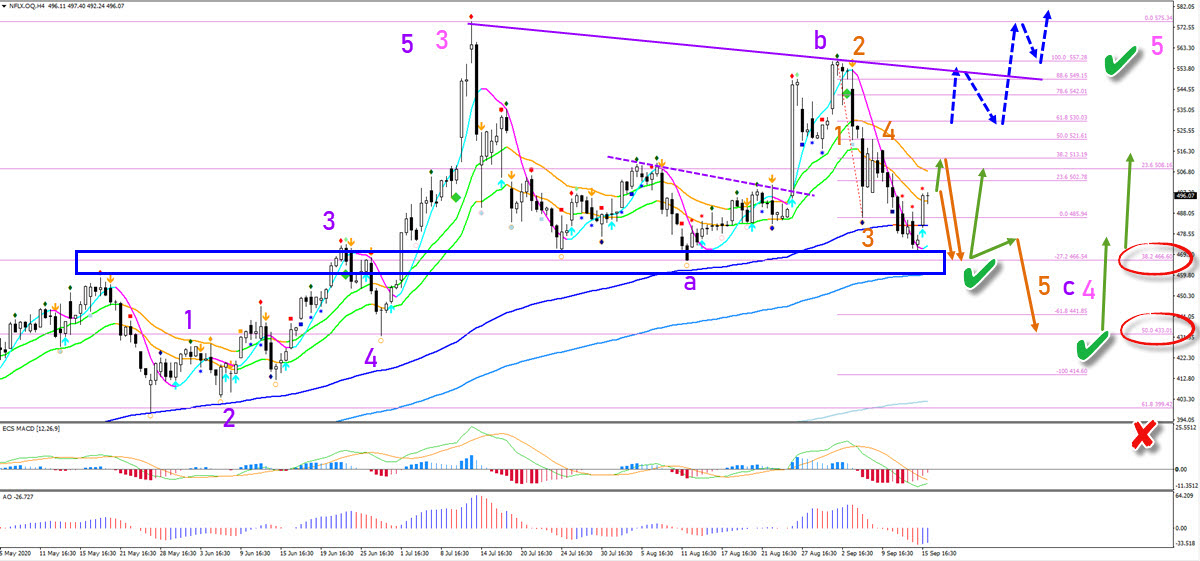
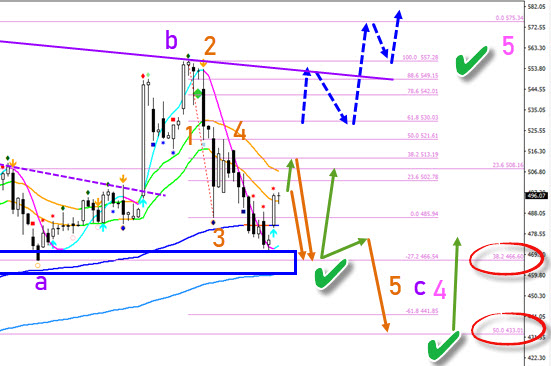
The Netflix chart is in a strong uptrend but the current bearish pullback is likely to continue lower for the moment. Price action is below the 21 ema zone. Furthermore, price action broke below the support fractals. The main bouncing spots seem to be slightly lower. The next bearish swing could complete a wave 5 (orange) of a larger wave ABC (purple) of wave 4 (pink). The first key support zone is at the -27.2% and 38.2% Fibonacci levels. The second support zone is located around the -61.8% and 50% Fibs. Bullish candlestick patterns at these price levels could make it an interesting stock.
Only a deep break below the 61.8% Fibonacci level invalidates (red x) the bullish outlook at the moment. An unexpected bullish break above the 61.8% Fibonacci level places the stock in an immediate uptrend (blue arrows). But the space towards any upside target could be limited to $600-650. For the moment, a deeper bearish pullback could provide a sufficient discount to expect a good bounce and run up. The Nextflix earnings date is expected around the end of October.
The analysis has been done with the indicators and template from the SWAT method (simple wave analysis and trading). For more daily technical and wave analysis and updates, sign-up to our newsletter.
Good trading,
Chris Svorcik


Leave a Reply