🔍 Microsoft Bullish Uptrend Expecting Small Dip to 38.2% Fibonacci 🔍


Dear traders,
the Microsoft stock (MSFT) remains in a solid uptrend. Recently, a strong bullish breakout occurred after a sideways, consolidation zone.
This bullish breakout was expected in our previous wave analysis from September. This is also indicating the potential for more upside in 2021.
Price Charts and Technical Analysis
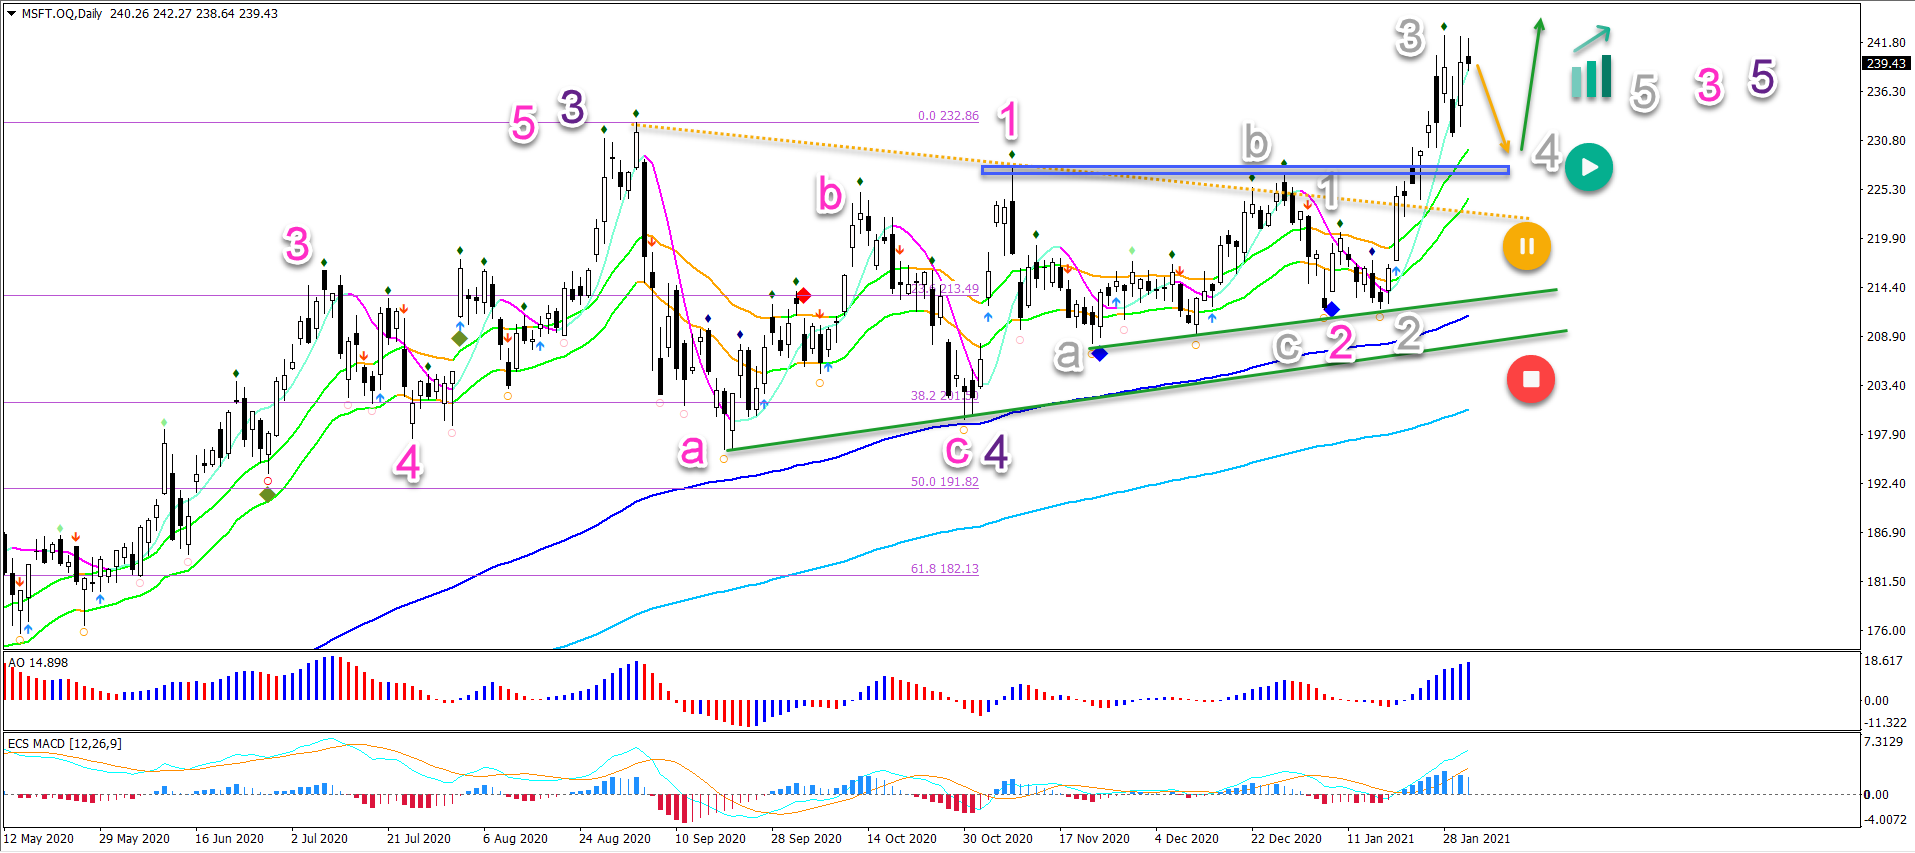
The MSFT stock seems to have completed an ABC (pink) pattern in wave 4 (purple) after a strong push up in wave 3 (purple). It was followed by a push up (wave 1 pink) and an ABC (grey) retracement in wave 2 (pink).
Let’s review the current situation:
- The current breakout is likely a wave 3 (grey).
- The failure for price to confirm a new higher high in recent days could be the end of the wave 3 and the start of a shallow wave 4 (grey) pullback.
- The usual retracements for waves 4 are shallow.
- With MSFT, the natural support zone (blue box) seems to be located at the previous resistance and the 21 ema support zone.
- The support zone is expected to create a bullish bounce (green arrow).
- Any deeper pullback places the uptrend in waiting mode (yellow pause button) or invalidates the current wave outlook (red stop button).
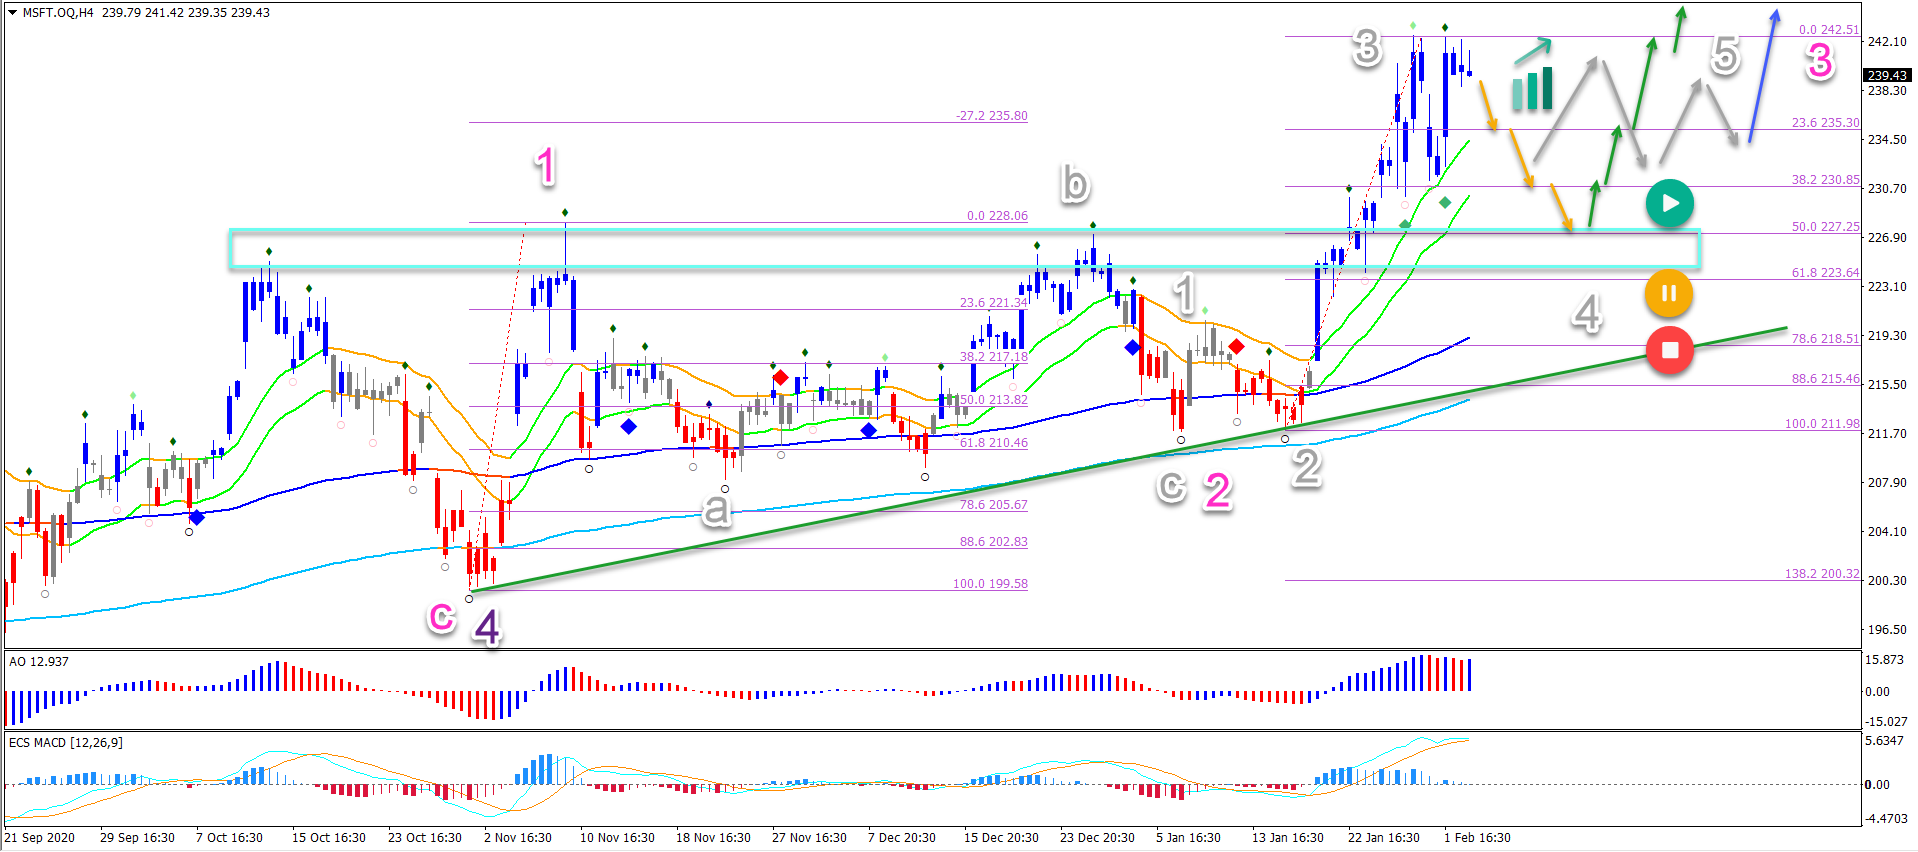
On the 4 hour chart, a small double top is indicating the difficulty for price action to break into higher ground. Some type of retracement or consolidation is expected:
- A bearish pullback (orange arrows) should take price back to support (blue box) and the Fibonacci retracement levels of wave 4 (grey).
- Price action could also build a shallow and sideways ABCDE triangle pattern (grey arrows).
Eventually a bullish bounce (green arrows) or breakout (blue arrow) is expected to take price action to higher levels again as long as price stays above the 61.8% Fib and especially the support trend line (green). Main targets are $250, $260, and $275.
The analysis has been done with the indicators and template from the SWAT method (simple wave analysis and trading). For more daily technical and wave analysis and updates, sign-up to our newsletter.
Good trading,
Chris Svorcik


Leave a Reply