How to Use Order Flow To Trade Forex Like a Prop Firm

Traders analyze technical and fundamental factors to understand price action and forecast the direction in which price is likely to move. Technical analysis involves the use of indicators to try and comprehend market momentum. On the other hand, fundamental analysis examines economic data to try and understand price action. While the two are commonly used analysis techniques, they fail to explain why price behaves a certain way at key price levels. Order flow analysis provides reliable information on traders’ key price-level actions.
What is Order Flow
Order Flow refers to the number of market orders waiting to be executed at a given price point. Traders tend to place pending orders waiting to be executed at support and resistance levels. For instance, whenever the price rises, it means more buyers than sellers place buy orders, thus pushing prices up.
However, after a significant move up, the upward momentum tends to fade as buyers become wary and start locking in profits as the price approaches a fundamental resistance level. As buyers plan to exit the market, sellers use the opportunity to place sell positions at the resistance level in anticipation of getting rejected and moving downwards. Selling order flow at the resistance level amounts to an influx of bearish pressure.
Order flow chart analysis is a special kind of analysis whereby traders predict with relatively decent accuracy where most traders are placing opposite trades. It is also referred to as supply and demand analysis, which involves finding areas of imbalance in order flow charts.
It involves looking at where there was an intense battle between buyers and sellers in the past. Looking at big moves in the price order flow charts is the easiest way to spot areas of extreme order flow activity with the naked eye. Additionally, traders also rely on order flow indicators to get insight into what is happening in the market.
If the price is moving up, order flow chart analysis will pinpoint a level where short sellers plan to enter the market. This will trigger more selling activity, pushing prices lower. Likewise, if the price moves downward, the analysis will detail a level where buyers increasingly place buy positions in anticipation of the price bouncing back.
Therefore, trading with order flow indicators can help predict where counter orders await at a future price level with a good amount of certainty. Consequently, it makes it easy to predict with some precision and confidence potential areas of price reversals.
In the financial markets, primarily in trading stocks, commodities, and futures markets, order flow charts pinpoint areas of order accumulation. It’s easy to determine such orders using volume order flow indicators, given the centralized nature of the market through which all orders pass.
On the other hand, the situation in the forex market is different, given the decentralized nature of the market. There is no reliable volume data that one can use to understand order flow in forex. In forex, it is completely different as no single broker tabulates all the orders following a given currency pair. The orders are distributed to a vast number of banks dealing with each other.
ATHENA EA

Order Flow in Forex
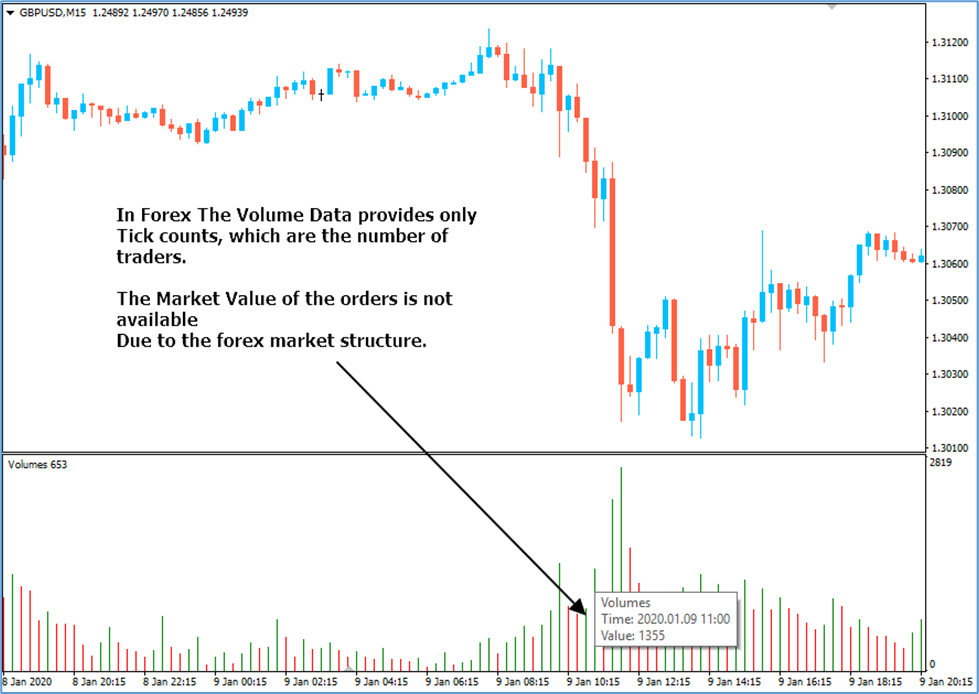
Nevertheless, it is still possible to understand order flow in forex with the help of previous price action activities. While volume order flow indicators don’t provide the true quantities of orders flowing into a currency pair, they provide reliable tick counts, which represent the number of trades flowing into specific brokers and not the entire forex market.
In forex, order flow charts are accumulated through tick counts. The tick count represents the number of traders placing trades at a given price level.
The GBPUSD order flow chart above clearly showed that GBPUSD was in a downtrend, making lower lows. After a significant move lower, the tick count starts building up, signals more traders are entering the market. Price bouncing with the formation of a double bottom signaled more buyers than sellers at the bottom of the chart compared to sellers who initially pushed prices lower.
As the price bounced back, the tick count increased, confirming more buyers in the market.
How to use Order Flow in Trading?
Understanding order flow is one of the easiest ways of gaining an edge in the market. Mastering how to read order flow also makes it easy to understand areas where strong price movements are likely to occur. Therefore, it becomes easier to buy at a very cheap price and sell at the highest and most expensive level.
How to Trade Order Flow: Buy Opportunity?
The order flow charts below show the Gold spot trending lower in the initial phase. However, upon price tanking to the $1685 level, short sellers come under pressure as buyers flock to the market and try to buy at the new lows. The $1685 level emerges as a key support or demand area, below which selling order flow is not in play.
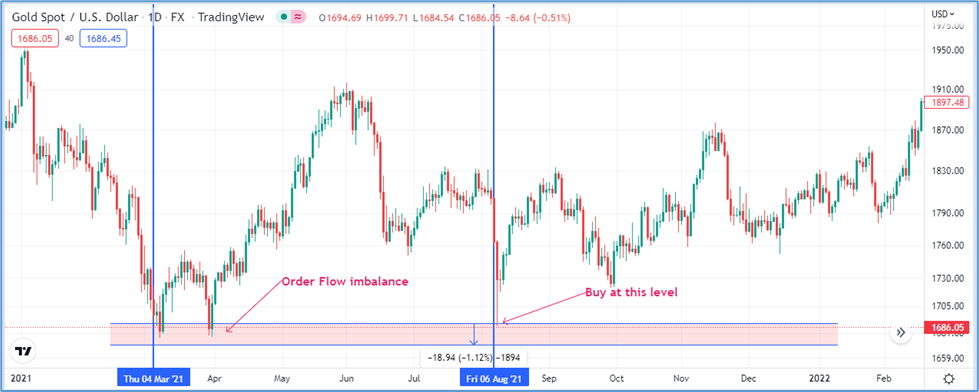
Price tried plugging below the $1685 level but to no avail. What this means is that the $1685 mark is a crucial order flow level implying buyers are increasingly placing buy positions whenever the price nears this level.
While the price did bounce back significantly from the order flow imbalance level, selling order flow flocked to the market and pushed the price to around August 6. Going by what happened in the past, it is clear that the $1685 level is a key support level below which selling order flow does not materialize to push prices lower.
Additionally, it appears the $1685 level is a key area of interest whereby buyers place buy orders in anticipation of the price bouncing back after touching this level. After August 6, it is clear that the price did bounce back as bulls overpowered the selling order flow by placing more buy orders. Therefore, traders looking to profit from order flow analysis could have placed a buy order at this level in anticipation of the price rallying afterward.
In addition to placing a buy order, it is crucial to put a stop loss order a few pips below the order flow imbalance level. The stop loss order will close the position and prevent significant losses if the price reverses course and moves below the critical support level.
How to Trade Order Flow: Sell Opportunity?
The Ethereum order flow charts below show a key area of order flow imbalance. It is clear that bulls lost momentum whenever the price rose near the 1280 level and struggled to push the price up. However, it is also clear that sellers used this opportunity to place selling order flow to push prices lower.
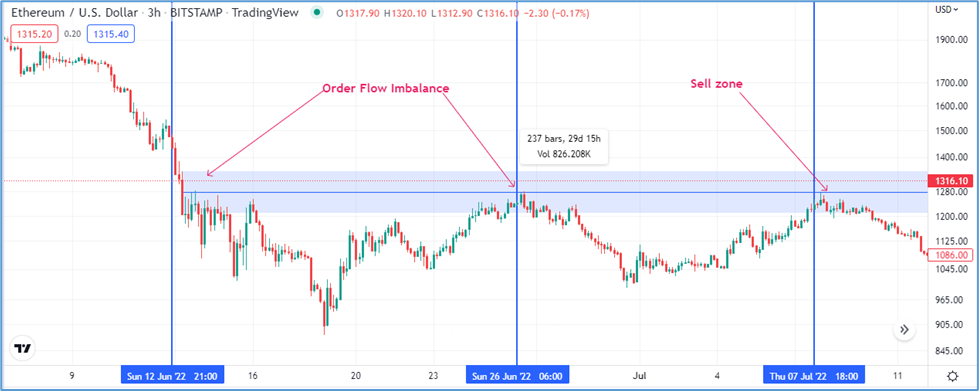
Consequently, the $1280 is a crucial order flow or area of solid resistance for bulls. Price action order flow at this level affirms a fundamental level of profiting from price edging lower afterward. Any trader who placed a sell position at this level ended up raking in significant pips on the price retreating and edging lower.
A stop-loss order can also be placed a few pips above the order flow imbalance level. The stop loss order will close the sell position and avert the risk of incurring significant losses if the price bounces back and powers through the order flow imbalance level.
Order Flow Trading Strategy: Trading with Limit Orders
One of the best order flow trading strategies entails trading with limited orders. Limit orders allow one to place buy or sell orders in advance, triggering a position once the price corrects to a key area of order flow imbalance.
Order Flow: Buy Limit Order
A buy limit order is a market order that allows one to open a buy position on price, plunging to a key support area or an area of order flow imbalance. It is an ideal market order for a trader who wants to decide on the minimum price they wish to open a buy position.

The use of the order flow indicator in the BTCUSD chart above shows price action in a range. It tends to bounce back as soon as the price tanks to the $1800 level. We can deduce that there is an influx of buy order flow at this level, whereby buyers are increasingly placing buy positions and looking to push prices higher.
Consequently, a trader can place a buy limit order at the $18100 level, which will trigger as soon as the price tanks to this level. The Buy limit order will allow one to go long on buyers pushing the price high above this level. A stop-loss order can also be placed a few pips below the order flow imbalance zone.
Order Flow: Sell Limit Order
The sell limit order flow order allows one to place a selling order flow that only triggers on price rising to this level. The sell limit order is placed at an area of order flow imbalance believed to be a level of strong resistance going by previous price action whereby bulls struggled to push the price higher.
The sell limit order will allow one to short sell the market on buyers failing to push the price above a key resistance level. A stop-loss order can also be placed a few pips above the order flow imbalance zone.
Order Flow Trading Strategy: Trading with Market Orders
Market orders allow one to open a position instantly at the current market price. Market orders are ideal for traders who want to capitalize on an immediate price move in the direction of the prevailing trend.
Order Flow: Buy Market Order
A buy market order allows one to go long on the current market price. The use of order flow analysis will pinpoint areas where there is more buying order flow compared to selling order flow. Placing a buy market order at such levels will allow one to profit from buyers pushing the price higher.
For instance, in the Gold order flow chart below, it is clear that buyers gained momentum and pushed the price higher after it touched the $1685 level. Placing a buy market order at this level would have allowed one to profit significantly from the price rallying afterward.
A stop-loss order can also be placed a few pips below the order flow imbalance zone to avert significant losses if the price reverses course.
Order Flow: Sell Market Order
A sell market order allows one to short sell the market at the current price. Using order flow analysis to identify areas of strong resistance and more selling order flow compared to buying order flow will allow one to profit from placing a sell market order.
For instance, in the Ethereum order flow chart below, it is clear that sellers gained momentum and pushed prices lower whenever the price rose to the $1280 resistance level. Placing a sell market order at this level would have allowed one to profit significantly from the price retreating afterward.

A stop-loss order can also be placed a few pips above the order flow imbalance zone to avert significant losses if the price bounces back.
Conclusion
Order flow analysis provides reliable information on key price levels where traders place counter orders. It makes it easy to predict potential areas of price reversals, allowing one to profit from trading in the direction of the prevailing trend.
Understanding how to read order flow charts and using order flow indicators makes it possible to gain an edge in the market. Additionally, combining order flow analysis with limit and market orders allows one to profit from price action at key levels.
Safe Trading
Team of Elite CurrenSea 🇺🇦❤️


Leave a Reply