How to Analyse a Stock in Five Simple Steps


Researching stocks can be an endless task. There’s an infinite amount of information out there from unlimited sources. So over the years, I’ve refined a five-step framework for analyzing a stock, with built-in stopping points that allow me to pause and dive deeper or carry on. It’s simple enough for anyone to use, and it delivers results that are suitable for pros. Here’s how it works, using Apple as an example…
Step 1: Examine its sales growth trajectory.
Everything starts with sales growth. There’s no profit, cash, or dividends without sales, so it’s hands down the most important aspect of any analysis. To gain an understanding of the long-term direction of future sales growth, you want to start with the firm’s track record. I like to go back at least ten years so I get the whole picture.
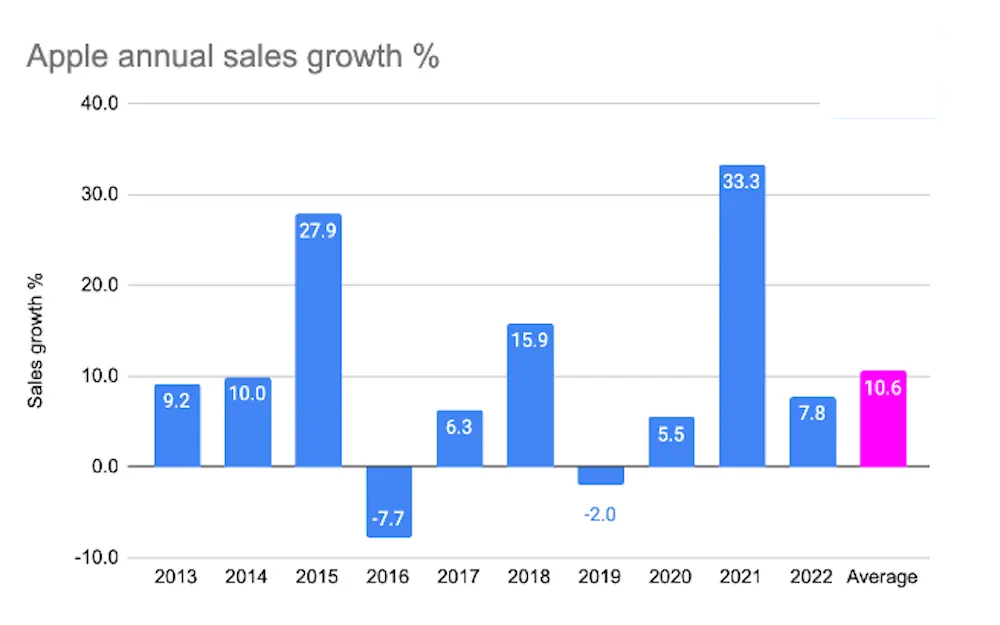
Apple’s annual sales growth, by year, in percentages. Source: Koyfin.
The first thing you notice from this chart is that Apple’s sales growth has been volatile, with some monster growth years, like 2021, as well as some down years, like 2016. That makes sense: Apple sells products that have cycles, with new and improved versions of its phones, laptops, and wearables released every year or so. When sales growth is volatile, the best thing to do is take an average. At 10.6%, the past ten years have been good for Apple.
Here’s your first stopping point: if you want a better understanding of the drivers of growth, you can break Apple into its different divisions or products, and see how each has performed over the years. That deeper dive could help you build a clearer picture of past performance, which, in turn, might help you formulate a more accurate view of its future.
Or you could just carry on: once you’ve got a handle on Apple’s past performance, you’ll want to turn that rearview mirror into a forward outlook – an opinion on Apple’s growth. You’ll need to decide whether you think Apple is likely to repeat, do better, or fall short of its past performance.
It’s a good idea to have a benchmark in mind: like global economic growth. And a reasonable long-term forecast for global growth is around 3%. So the key question is whether you think Apple will grow faster or slower than that. Maybe like me, you’d bet that, with its rapidly growing services business (about 20% of sales), it’ll do better. So perhaps sales will grow between that global economic growth norm of 3% and the firm’s stellar past performance of 10% (which would be hard to repeat, after all) – so let’s say 7%.
Step 2: Compare profit growth to sales growth.
Next, you want to look at profit growth. The puzzle you’re trying to solve here is whether profit growth will outpace your 7% sales growth forecast. Like before, your starting point is past performance – this time on the bottom-line profit, or net income growth. You can break this into two parts: first is operating profit – earnings before interest and tax (EBIT) – and the second is net profit – earnings after interest and tax.
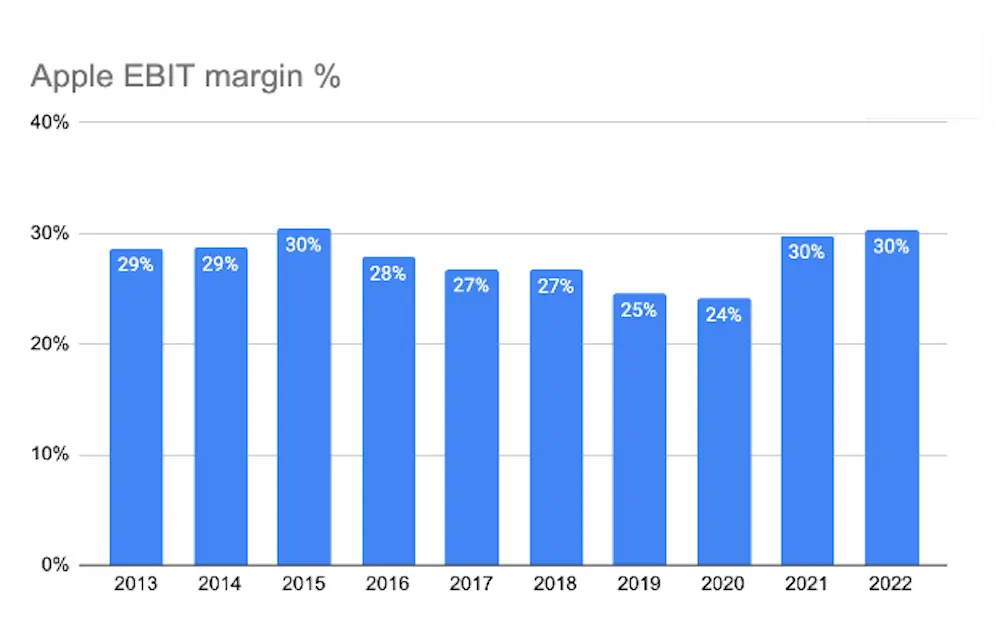
Apple’s EBIT profit margin. Source: Koyfin.
Start with EBIT. The only way Apple can grow EBIT faster than sales is for costs to grow more slowly, which means EBIT margins swell (margin being profit as a percentage of sales). A glance at the chart tells you that Apple’s profit margin has gone nowhere in ten years. In fact, it had been gradually declining until the pandemic came along and sent Apple’s sales skyrocketing (which boosted profits as sales growth trounced cost growth).
But let’s turn forward again. If Apple’s EBIT margins have flatlined during a period where sales growth was a robust 10.6%, it might be tough to get margins much higher from here, especially given that we expect sales growth to slow.
Here’s your second pit stop: for a deeper dive at this junction, you can dig out the margin profile for each business line or product, and build up from there. This is a little harder to get your hands on, mind you. Not all firms break out profit margin by product or business line. Apple discloses profit for “products” (iPhone, Mac, wearables) and “services” (iTunes, App Store).
Otherwise, you can stick to the 30,000-foot vantage point and sensibly, in my opinion, assume that margins will stay roughly the same going forward.
Next, take a look at the net profit line. Here, instead of deciding whether running costs will grow slower or faster than sales, you need to think about interest and tax. Remember that net profit is EBIT minus interest and tax.
Now, we have had an increase in interest rates recently, but Apple doesn’t have a big debt burden. And corporate tax rates haven’t shifted lately. So, in general, unless you think these two cost lines might change dramatically for some other reason (like, say, a company is planning to repay a huge amount of debt or take on new debt to buy another firm) then it’s reasonable to assume net profit will grow inline with EBIT: so, 7% for Apple.
ATHENA EA

Step 3: See how much profit becomes actual cash.
Here’s the thing about profit: it doesn’t always convert into cash. Imagine a situation where your company sells a product for more than it costs to make it: that’s a profit. But now imagine that it’s had to pay its suppliers upfront and its customers are dragging their heels. It’s turned a profit, but hasn’t collected any cash. Similarly, imagine if all the profit it generates needs to be plowed back into maintaining the machines in its factory or into giving its storefront a face-lift. Basically, as an investor, you need to see how successful a firm is at converting its profit into cash. That’s because cash is really all that matters. After all, it’s cash that can pay dividends, repurchase shares, and acquire other firms – not profit. It’s also cash that is central to how we will value Apple in the end.
To kick this particular tire, you need to go back and look at a firm’s ratio of free cash flow to net income. Free cash is what’s left over after day-to-day expenses and project outlays. You can pull this info from a firm’s cash flow statement. To calculate free cash flow, you take operating cash flow (sometimes called “cash from operations”) and subtract capital spending (most firms, like Apple, call this “purchases of property, plant, and equipment”). Apple has consistently converted 100% or more of its net income into free cash flow.
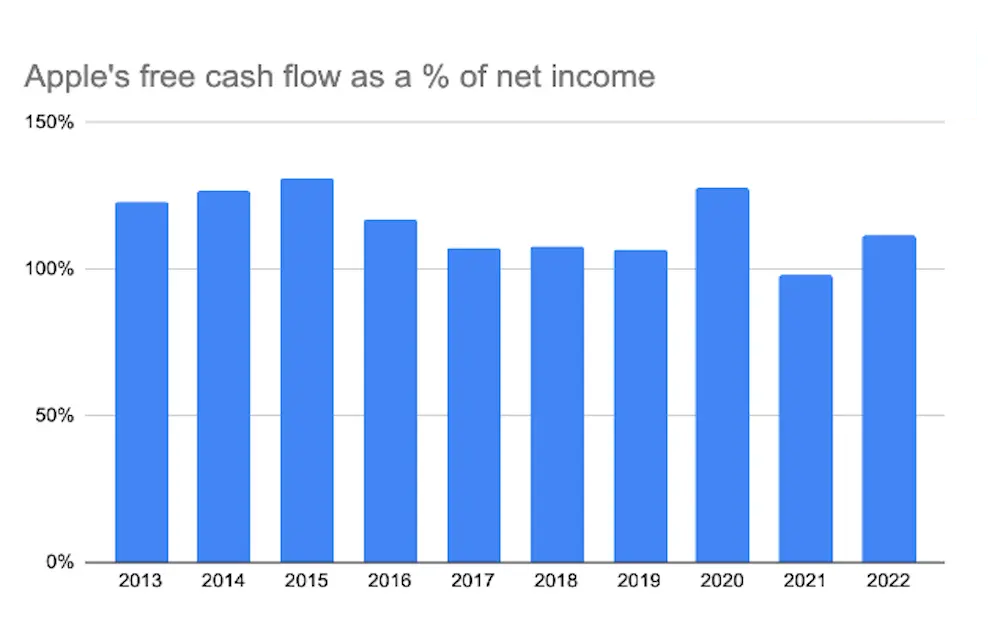
Apple’s free cash flow as a percentage of net income. Sources: Finimize and Koyfin.
Here’s your third pit stop: if you want to do a deep dive here, I suggest you look at those differences between when Apple gets paid for its sales versus when it has to pay its suppliers. You’re looking for “accounts receivable” and “accounts payable”. Basically, if the former is smaller than the latter, then as a firm grows, it’ll get money in the front door faster than it sends it out the backdoor to pay suppliers, boosting cash flow. This is known as “negative working capital”. Beware, though, because if sales start to decline, negative working capital can work in the opposite direction, and can be a drain on cash flow.
For your big-picture, 30,000-foot view, you can simply assume that the 100% conversion will continue. And that means that free cash flow should grow in line with net income, again at 7%.
Step 4: Inspect the company’s overall foundations.
You’re looking for a yes or no answer to the question: is this firm built on stable foundations? In simple terms, you’re looking at whether the firm’s debt pile is high enough to derail all our free cash flow growth analysis. If it is, then, at best, all that free cash flow could get channeled into trimming the debt burden rather than rewarding shareholders with presents like dividends and buybacks. At worst, the firm could buckle under its weight.
Now, not all debt is equal. Some companies (think: stable industries with very predictable sales) can – and arguably should – make full use of debt financing. A nice rule of thumb is to be wary of net debt levels (that is, after subtracting cash) that are more than 2.5 times higher than profit. You can see a firm’s net debt on its balance sheet. You’re looking for long-term debt on the liabilities side of the balance sheet and cash on the asset side.
Luckily, Apple’s debt burden won’t have you losing any sleep. At $50 billion, Apple’s net debt is a fraction (roughly half) of its profit for a single year. Given the level of cash that Apple produces, it could be free from debt in no time at all.
Step 5: Check the valuation.
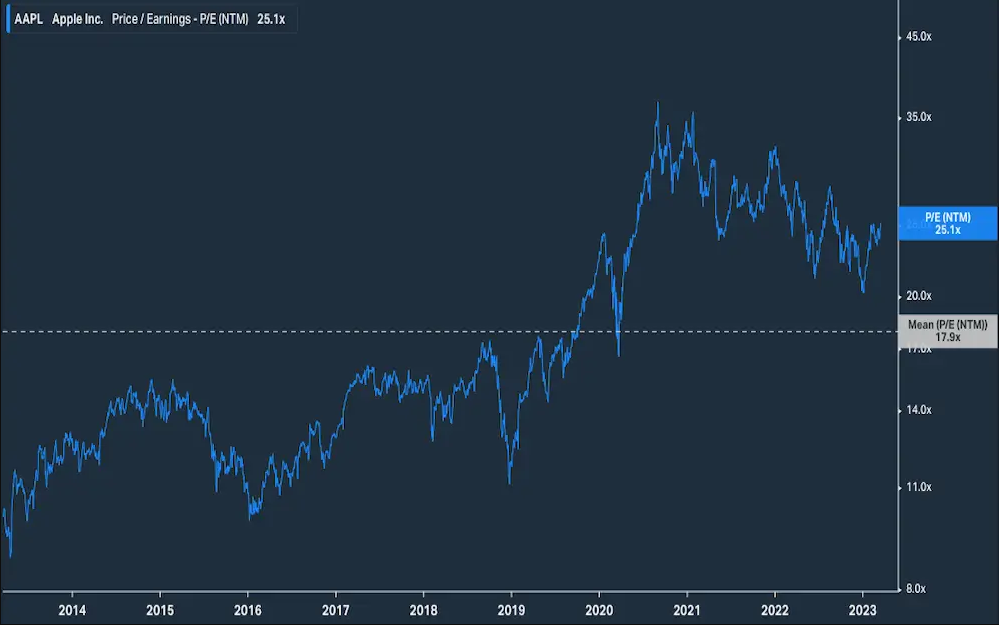
For growth firms like Apple, traditional valuation multiples like price-to-earnings (P/E) ratios can be a bit misleading. See, despite its historical success, the stock price reflects all future cash flows. That said, Apple’s relatively high 24x P/E ratio is above its ten-year average.
In conclusion, Apple has a solid financial position and growth prospects. Sales and earnings should grow around 7% annually, and the company generates ample free cash flow while maintaining a reasonable debt level. However, at 24 times earnings, the stock seems fully valued. I would rate Apple a hold, waiting for a better entry point..
Safe Trading
Team of Elite CurrenSea 🇺🇦❤️


Leave a Reply