☝️ Google Testing 38.2% Fib Support After 8% Decline ☝️

Dear traders,
Google (GOOG) made a bullish breakout above the bull flat pattern as expected in our previous wave analysis. But a bearish pullback is taking place soon after price confirmed a higher high.
Price action is now testing the key support trend line (green) and the Fibonacci support. Let’s review what to expect.
Price Charts and Technical Analysis
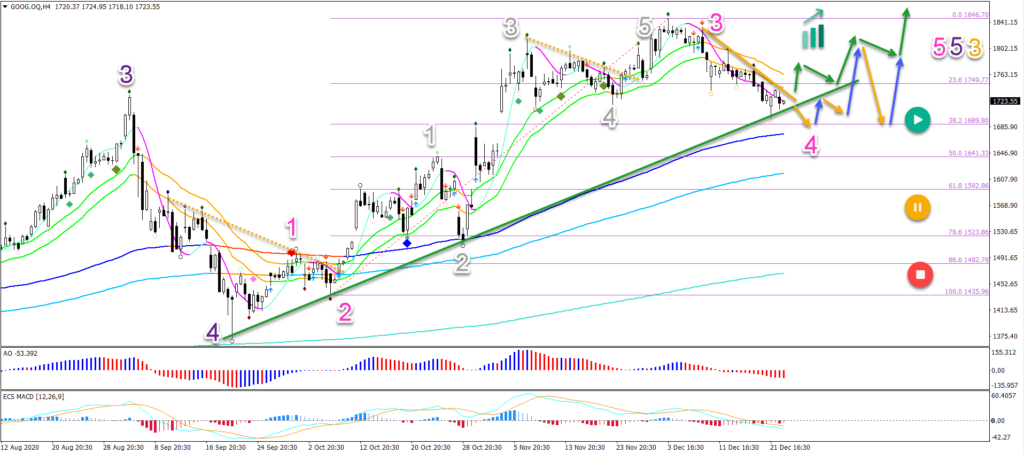
Google seems to be in a wave 4 (pink) pattern. This means that the 38.2% Fibonacci retracement level is a key support zone within the uptrend.
A bullish bounce at the Fib could confirm our view. But a breakout above the resistance trend line (orange) and 21 ema zone is needed to indicate the end of wave 4 and start of wave 5 (pink).
Even a deeper retracement towards the 50-61.8% Fibonacci zone could be part of a wave 4. But a break below the 61.8% Fib certainly places the uptrend on hold (yellow circle) whereas a break below the top of wave 1 invalidates it (red circle).
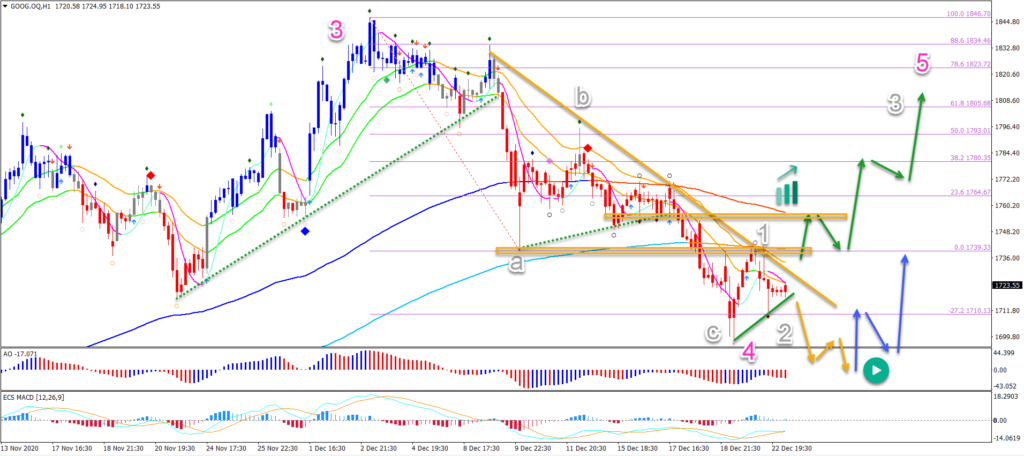
On the 1 hour chart, price action is building an ABC (grey) pattern. Which could complete wave 4 (pink) if price action can break above the local resistance (orange boxes) and long-term moving averages.
A break below the support trend line (green) indicates a push towards the 50% Fibonacci level mentioned on the 4 hour chart.
The bullish targets are first $1,800, followed by the previous top at $1,846 and the -27.2% Fibonacci target at around $1,950.
The analysis has been done with the indicators and template from the SWAT method (simple wave analysis and trading). For more daily technical and wave analysis and updates, sign-up to our newsletter.


Leave a Reply