☝️ Google Impulsive Bullish Breakout Now Looking for Support at Fib Levels ☝️

Dear traders,
the Alphabet stock (GOOG) made a strong bullish breakout above the triangle pattern. The breakout is taking place in a well established uptrend channel (green lines).
This article reviews whether the uptrend can continue higher or not. We also review key support and resistance levels plus potential targets.
Price Charts and Technical Analysis
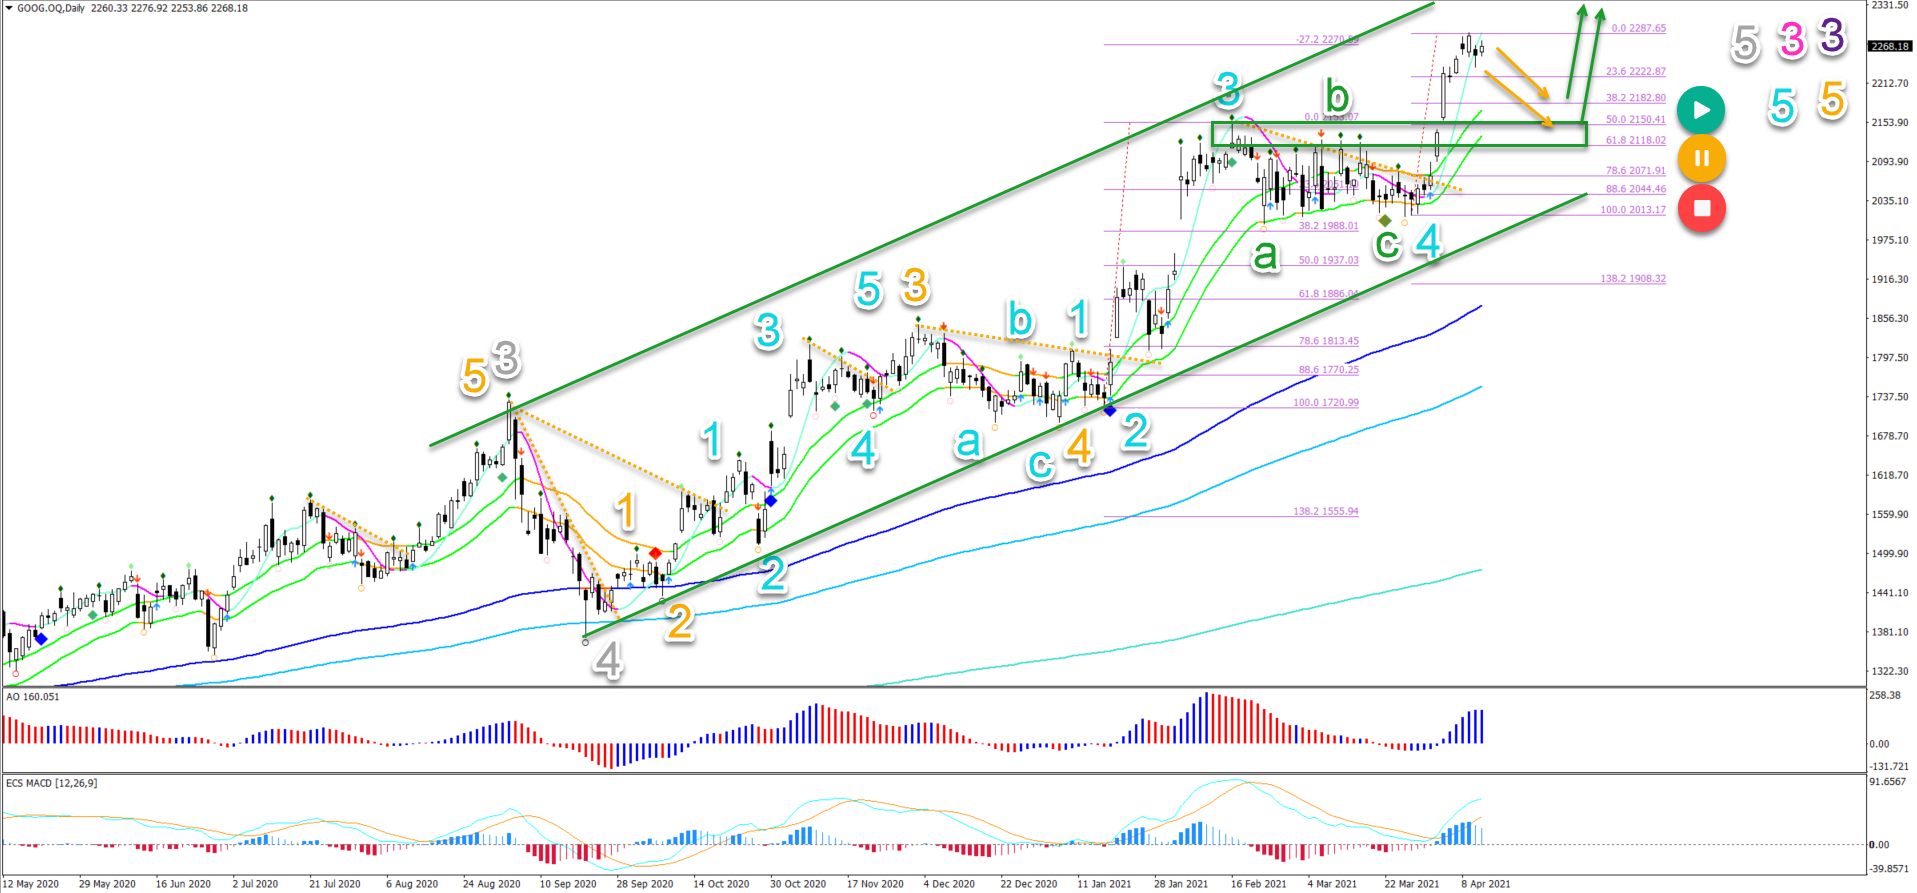
The GOOG stock triangle chart pattern completed an ABC (green) within a shallow wave 4 pullback.
Price action bounced at the 38.2% Fibonacci level and has already reached the -27.2% Fibonacci target. What can be expected next?
- No divergence pattern is visible so far. This means that the uptrend remains strong and impulsive, which is indicating that bulls remain in control.
- The current bullish price swing is part of a larger wave 3 (pink) of wave 3 (purple), which indicates that more upside is likely.
- A full uptrend is visible with a clear uptrend channel (green lines) and moving averages aligned with the 21 ema above the 144 ema and above the 233 and 610 EMAs.
- Considering the strong price push away from the 21 ema, it is likely that the Fibonacci levels of the most recent price swing will act as support and cause a bounce (green arrows) if a pullback occurs (orange arrows).
- The next targets are located at $2400, $2500, and $2600.
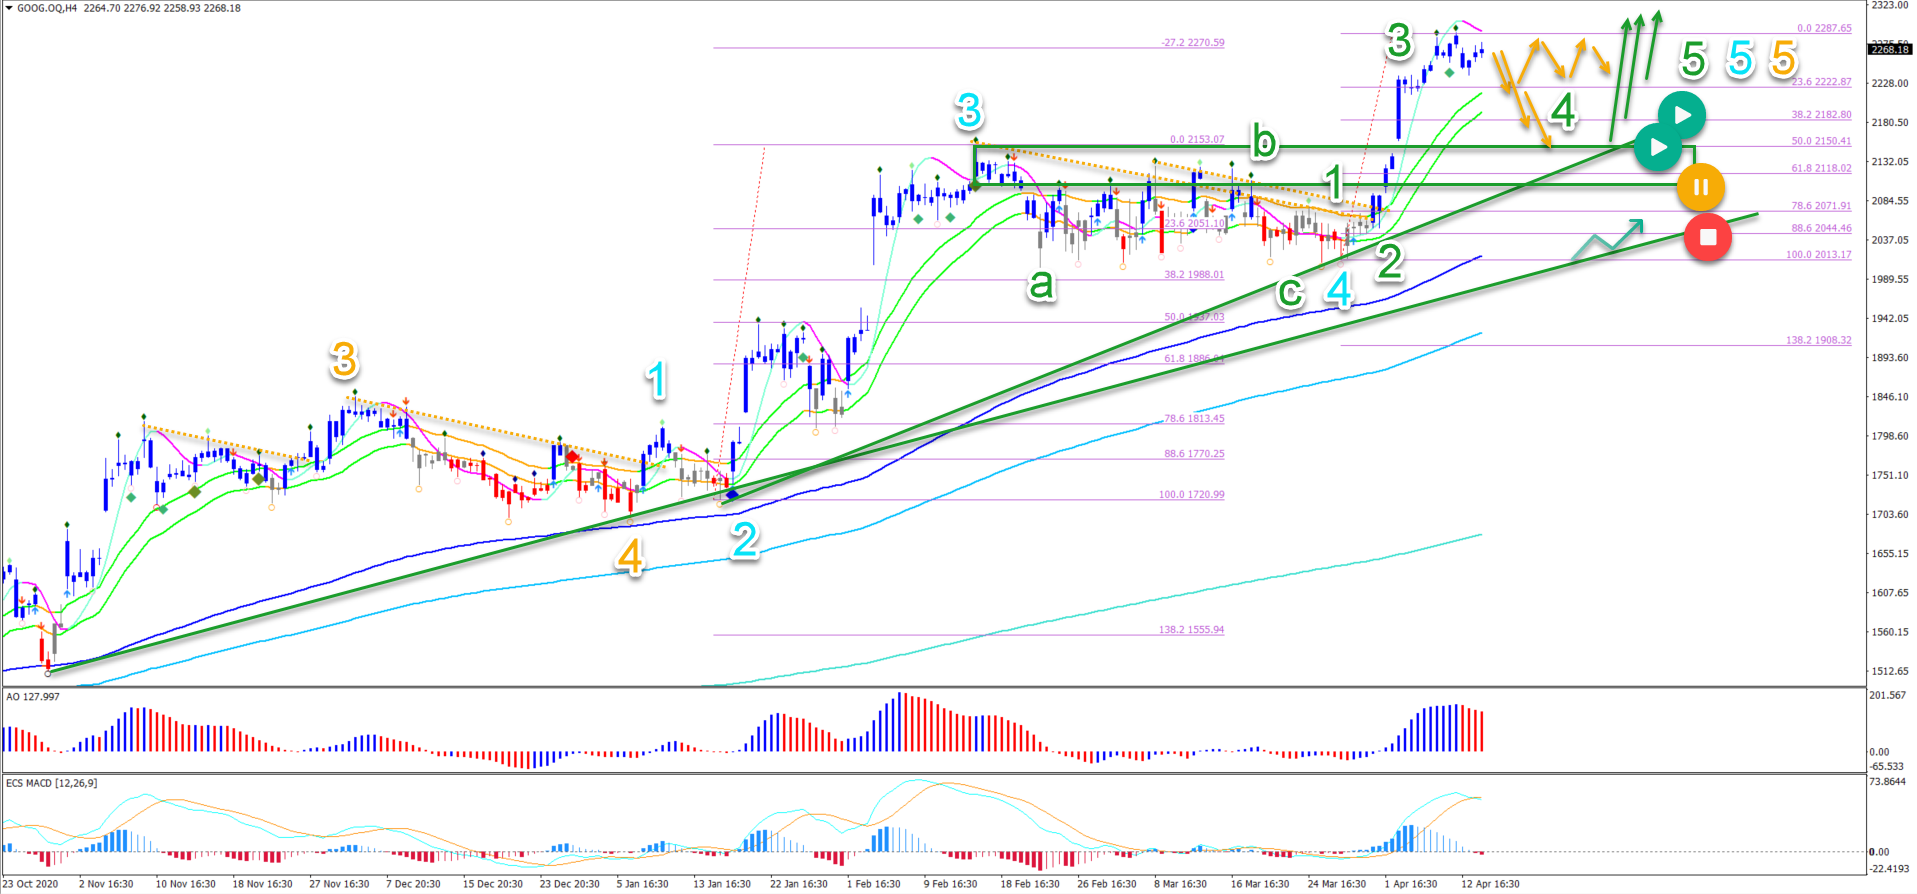
On the 4 hour chart, we can see multiple waves 3 already appear in the recent past. This is indicating a strong uptrend.
- Currently price is in a wave 3 (green). Price could continue higher within wave 3.
- Eventually now or later, a shallow pullback (orange arrows) could confirm the end of the wave 3 (green) and the start the wave 4 (green).
- The Fibonacci levels are expected to act as support for a bounce (green arrows).
- A break below the previous tops (green box) could place the current wave outlook on hold (orange circle) or invalidate it (red circle).
- A deeper retracement does not mean that the uptrend is over. Price action could still bounce at the 144 ema close.
The analysis has been done with the indicators and template from the SWAT method (simple wave analysis and trading). For more daily technical and wave analysis and updates, sign-up to our newsletter.
Good trading,
Chris Svorcik


Leave a Reply