☝️ GOOG Stock Could Offer 10% Discount After Pullback ☝️

Dear traders,
the Alphabet Inc (GOOG) is building a bearish retracement within a strong uptrend. Our article reviews the key bull and bear lines.
This will determine whether a deeper pullback against the trend will take place. Or will the bulls manage to continue higher in the trend.
Price Charts and Technical Analysis
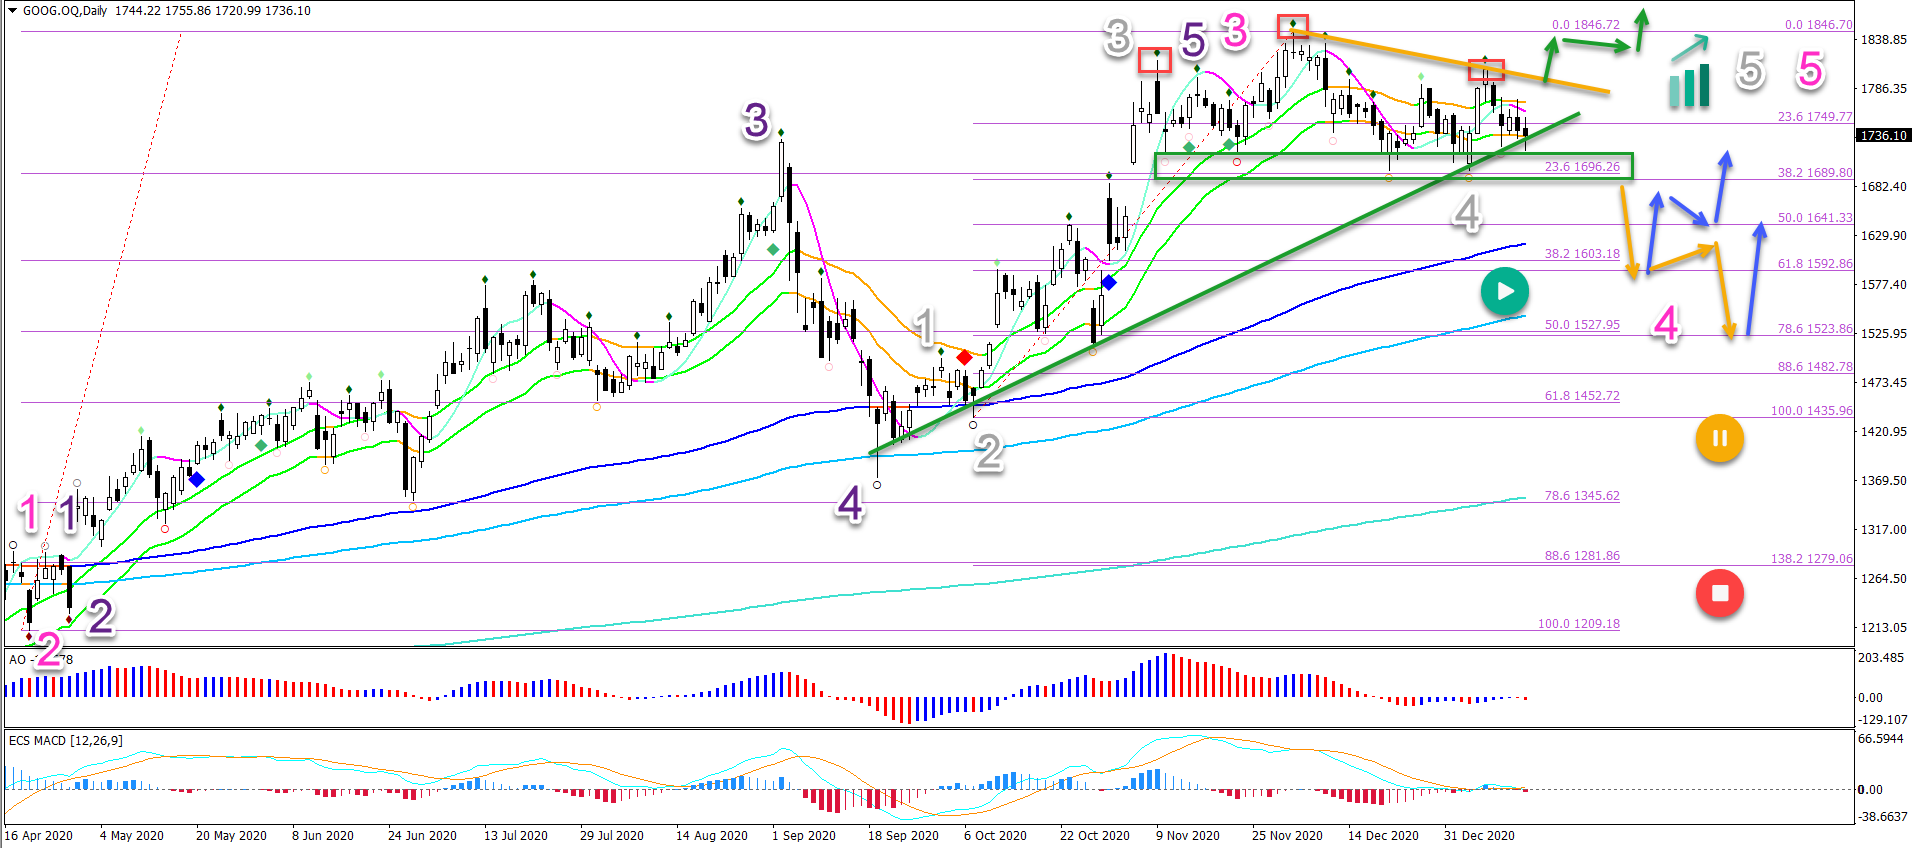
The GOOG stock is showing a head and shoulders reversal chart pattern (red boxes). The support line (green) is the main decision zone for a potential reversal.
- A bearish breakout (orange arrows) confirms the deeper bearish retracement towards the long-term moving averages and Fibonacci levels.
- It also confirms the deeper wave 4 (pink) development rather than the shallower wave 4 (grey).
- An immediate breakout (green arrows) above the resistance (orange) indicates a potential uptrend continuation.
- The Fibs are expected to act as a bouncing spot (blue arrows).
- Only a deeper retracement places the uptrend in question (yellow & red circles).
On the 4 hour chart, the sideways price action is an ABC (orange) pattern. The main question is whether the ABC pattern is complete OR will price action expand it.
- The end of the ABC is confirmed by a bullish breakout.
- The continuation of the ABC pattern can take place with 2 variants:
- ABCDE triangle chart pattern
- Deeper ABC retracement after bearish breakout
In all cases, an uptrend is expected eventually. Unless price pushes below the $1,500 round level.

The analysis has been done with the indicators and template from the SWAT method (simple wave analysis and trading). For more daily technical and wave analysis and updates, sign-up to our newsletter.
Good trading,
Chris Svorcik


Leave a Reply