🎯 FedEx Aims for +20% Target Despite Strong Decline 🎯


Dear traders,
the FedEx Corporation (FDX) has recently retraced to and bounced at the 38.2% Fibonacci retracement level.
This analysis reviews the potential wave and chart patterns connected to a 38.2% Fib bounce. We also pinpoint the best target for the upcoming few trading weeks.
Price Charts and Technical Analysis

The FDX daily chart has retraced down to the 38.2% Fibonacci and 144 ema zone. But the overall trend is strongly up. We can see this simply by adding long-term moving averages (blue box).
The quick pace of the decline, however, does indicate that the retracement is likely to be lengthy or deeper than usual for a wave 4 (grey). Here is what to expect, starting with the most likely:
- An ABCDE triangle chart pattern (as shown in the image)
- An ABC bull flag pattern
- An ABC zigzag pattern
Although price action made a strong decline, a bullish bounce back towards the deep Fibonacci levels and previous top is likely to occur within a wave B (orange). The main target zone is therefore around $292-$305 for the short-term.
At the moment, a bearish bounce is expected at the target zone to create a wave C (orange). Eventually a new high is expected at around $350 once the triangle is completed (blue arrow).
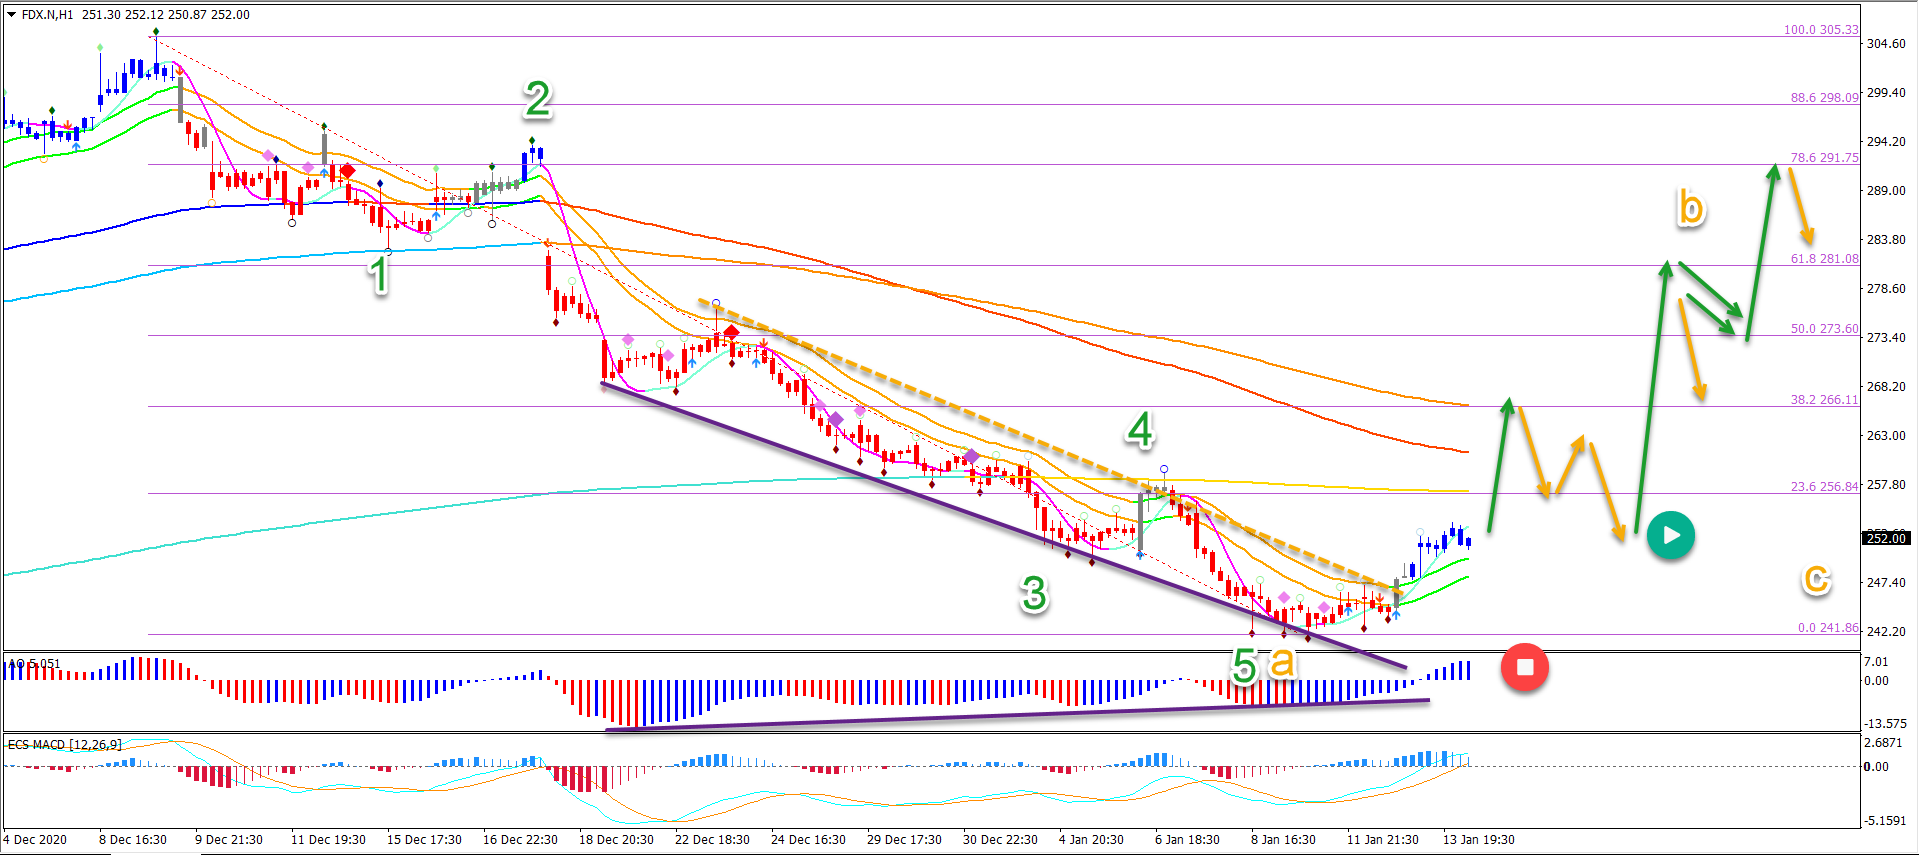
On the 1 hour chart, we already see blue Elliott Wave candles emerge. This is indicating the potential start of the bullish run in wave B (orange).
The first target is the 38.2% Fib zone and long-term moving averages. Here we expect a bounce down and a higher low before a new bullish swing up again.
The analysis has been done with the indicators and template from the SWAT method (simple wave analysis and trading). For more daily technical and wave analysis and updates, sign-up to our newsletter.
Good trading,
Chris Svorcik


Leave a Reply