🎯 DJI 30 Close to Full Uptrend Continuation Despite Wedge 🎯


Dear traders,
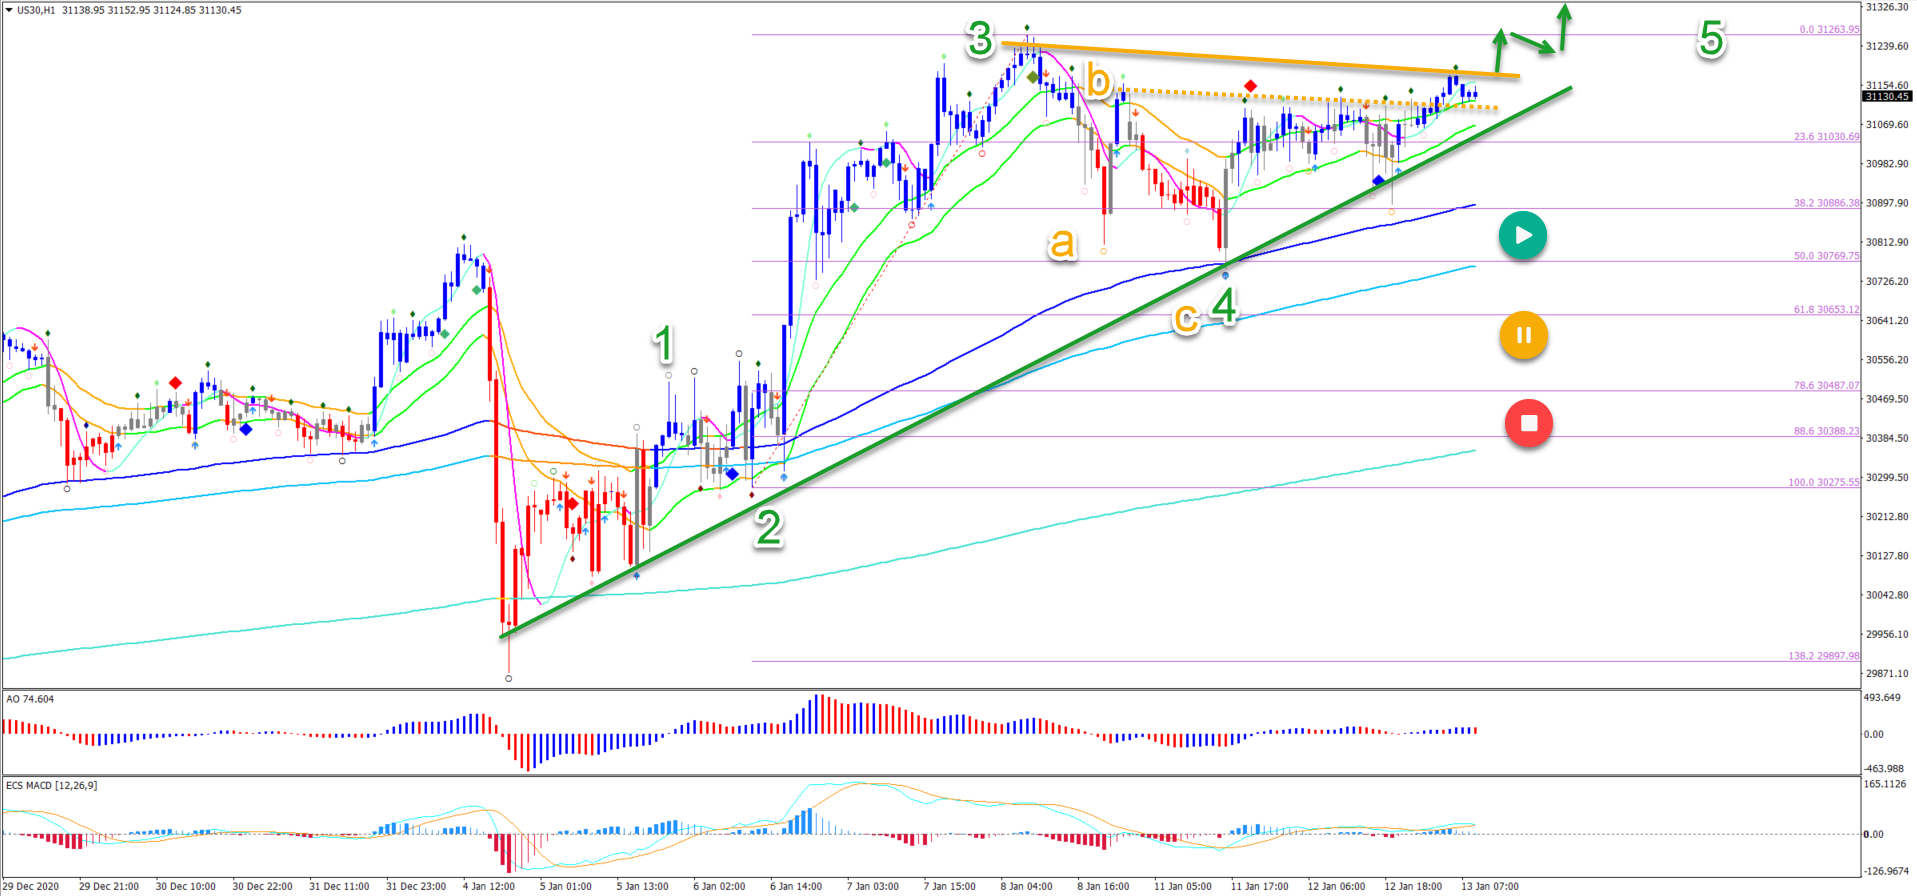
the Dow Jones Index (US 30) is in a strong uptrend. Although price action has recently become quite slow and choppy. Also, a rising wedge pattern is visible as well. Will the bulls be able to push through resistance to keep the uptrend alive?
Price Charts and Technical Analysis

The US30 chart needs a break above the current high at 31,263 to confirm the uptrend.
A bullish breakout could trigger strong momentum to the upside, because price action is breaking the wedge.
A bearish break below the 21 ema zone, however, is not worrying for the bulls.
- Price action could simply be making a deeper retracement.
- A bullish bounce at the long trend line and moving averages is likely.
- Only a deeper break below the long-term MAs could put the uptrend on pause (yellow & red circles).
On the 1 hour chart, we can see that an ABC (orange) pattern has been completed at the 50% Fibonacci level. A bullish bounce seems to confirm the end of the wave 4 (green).
A bullish break above the resistance trend line (orange) could confirm the uptrend continuation. Main targets are located at $31,500 to $32,500.
The analysis has been done with the indicators and template from the SWAT method (simple wave analysis and trading). For more daily technical and wave analysis and updates, sign-up to our newsletter.
Good trading,
Chris Svorcik


Leave a Reply