🔍 Alphabet (GOOG) Strong Decline Puts Bulls in Waiting Mode 🔍
Dear traders,
the Alphabet (GOOG) has made a serious decline in the past trading days. The bearish momentum is strong and testing the Fibonacci levels and long-term moving averages. Can GOOG make a bullish recovery?
Price Charts and Technical Analysis
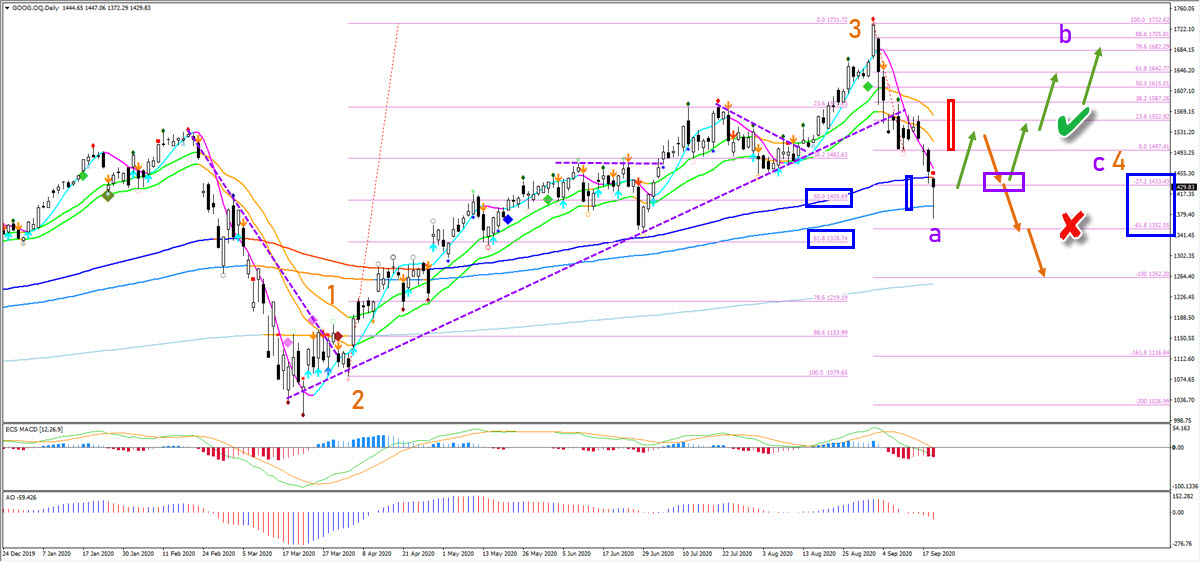
Probably yes. The support zone is very strong (blue boxes) and a bullish bounce is likely to take place. The 50-61.8% Fibonacci retracement levels combined with the 144-233 emas should send price action higher. The next question is whether price will be able to fully break above the 21 ema zone. Also here a bounce is probable and the bears could push it lower to test the previous bottom. This is when the moment of truth for the Alphabet stock arrives. Will price action break through the bottom for a larger bearish correction (orange arrows)? Or will it bounce and test the previous top (green arrows)? The answer depends on the chart and price patterns that emerge around the key support zone (purple box).
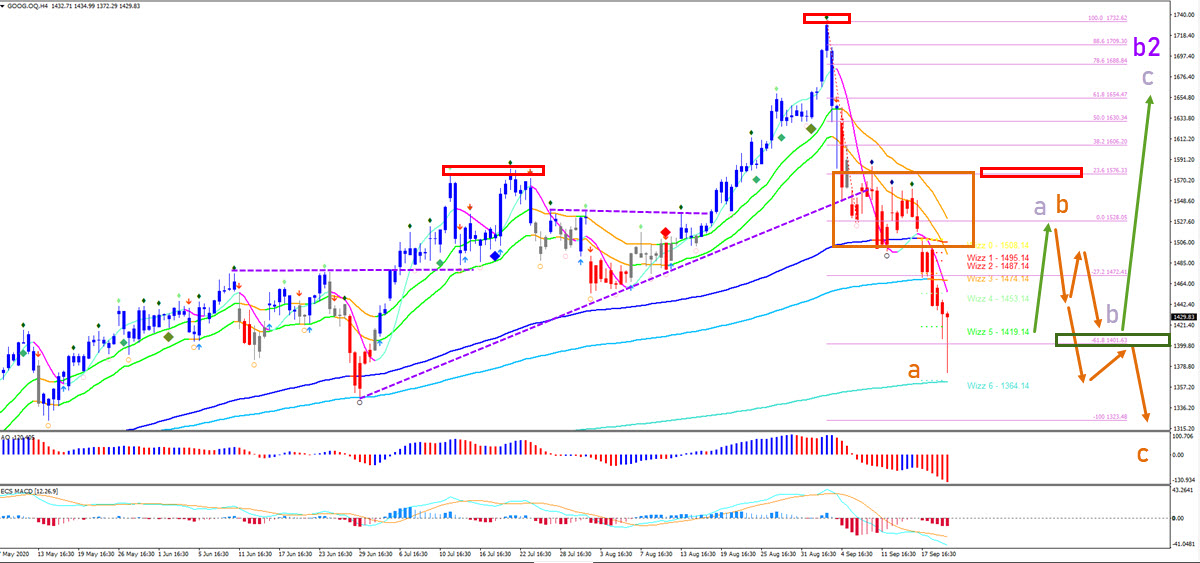
Alphabet is likely to make a bullish bounce due to the pinbar. The bullish wick at the bottom of the current candlestick is indicating buying pressure. But as price moves up, it will face hefty resistance from the head and shoulders zone (red boxes) and the consolidation zone (orange box). A bearish break below the -61.8% Fibonacci (green box) confirms a deep bearish ABC (orange) pattern. A bullish bounce at the green box makes a bullish ABC (purple) more likely.
The analysis has been done with the indicators and template from the SWAT method (simple wave analysis and trading). For more daily technical and wave analysis and updates, sign-up to our newsletter.
Good trading,
Chris Svorcik


Leave a Reply