? S&P500 Bullish Breakout Shows Strength of Uptrend ?


Dear traders,
the S&P 500 showed a very strong breakout above the previous top and all-time high. The uptrend seems ready for an immediate continuation. What kind of targets can traders expect?
Price Charts and Technical Analysis
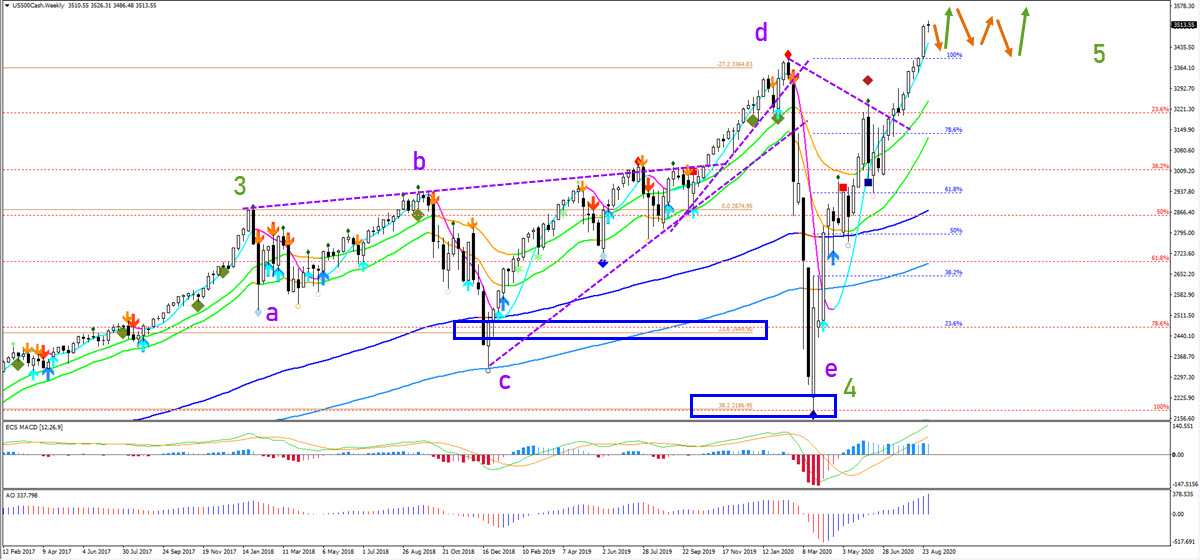
The S&P 500 showed clear and strong candle closes near the high on all 3 higher time frames, including the monthly, weekly and daily charts. The candles were large in size and closed near the high indicating clear bullish control in each candle. The weekly chart is showing the potential for price to complete one last wave 5 (green) after finishing a wave 4 (green) pullback. The wave 4 retracement could have been an expanding ABCDE (purple) wedge. The waves C, D and E respected the 23.6%, -27.2%, and 38.2% Fibonacci retracement levels neatly.
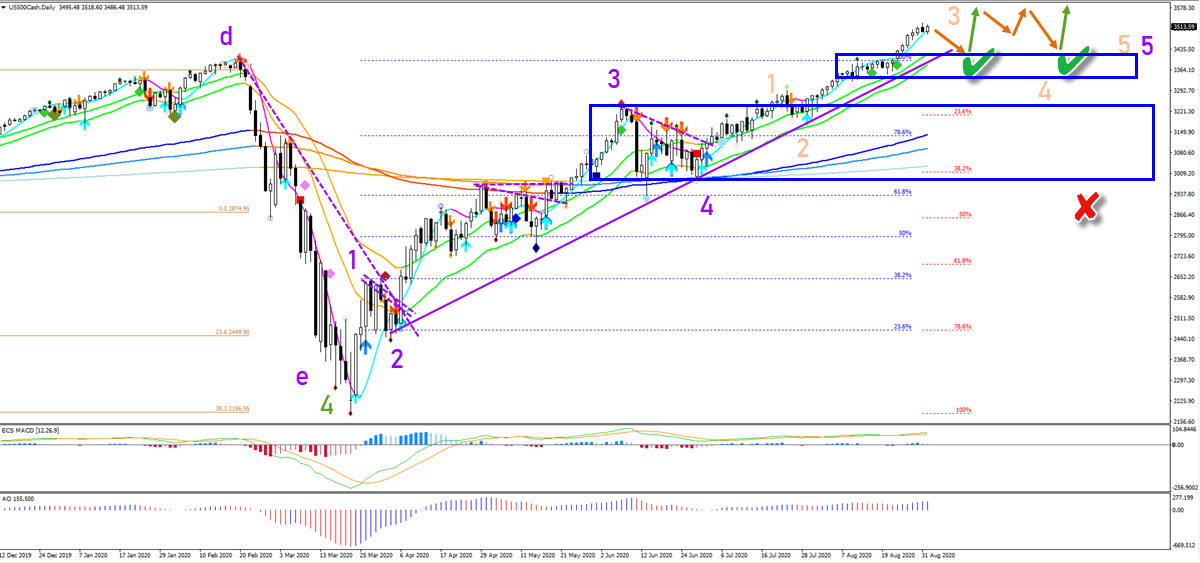
The S&P 500 chart is showing a clear uptrend as well. The purple trend line shows the support. The critical breakout occurred when price action crossed and broke above the long-term moving averages (144, 233, 610 ema). The current push up seems to be a wave 3 (orange). A mild shallow pullback should be part of wave 4 and an immediate uptrend continuation. But multiple waves 3-4 are also possible as price action could test and bounce at the 21 ema zone at least twice more. Any deeper retracement remains a potential support too at the blue boxes. Only a break below the 38.2% Fib makes a bullish outlook less likely (red x). Targets are located at 3680, 3850, 3980, and 4140.
The analysis has been done with the indicators and template from the SWAT method (simple wave analysis and trading). For more daily technical and wave analysis and updates, sign-up to our newsletter.
Good trading,
Chris Svorcik


Leave a Reply