🔓 NQ100 Bearish Reversal at Fibonacci Targets 🔓
Dear traders,
the NASDAQ 100 (NQ) has made a major bearish bounce after reaching strong Fibonacci targets (red circles). How deep will the pullback go before price action finds support within the larger uptrend?
Price Charts and Technical Analysis
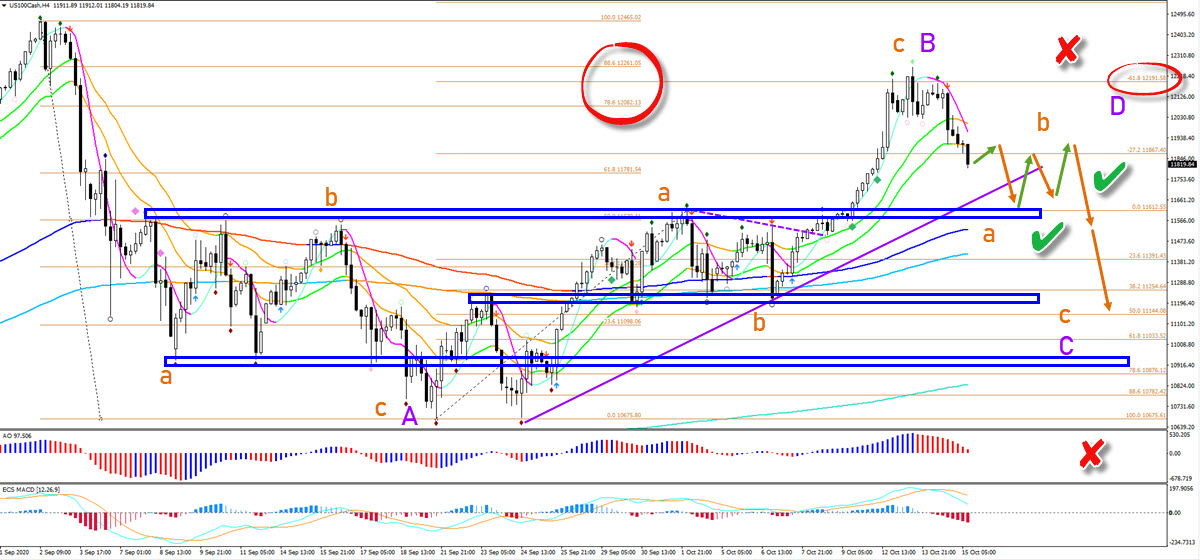
The NQ 100 has completed a bullish ABC (orange) pattern within wave B (purple). The strong bearish price action at the Fibs plus the break below the 21 ema zone seems to indicate a pause in the uptrend and a wave C retracement (purple).
The wave C can develop either in an ABC (orange) or a 5 wave pattern. The NQ could be building a larger ABCDE triangle chart pattern in case of an ABC.
The image shows the most likely price movements and expected patterns in my view. The formation is valid if price action does not break the top nor the bottom (red x).
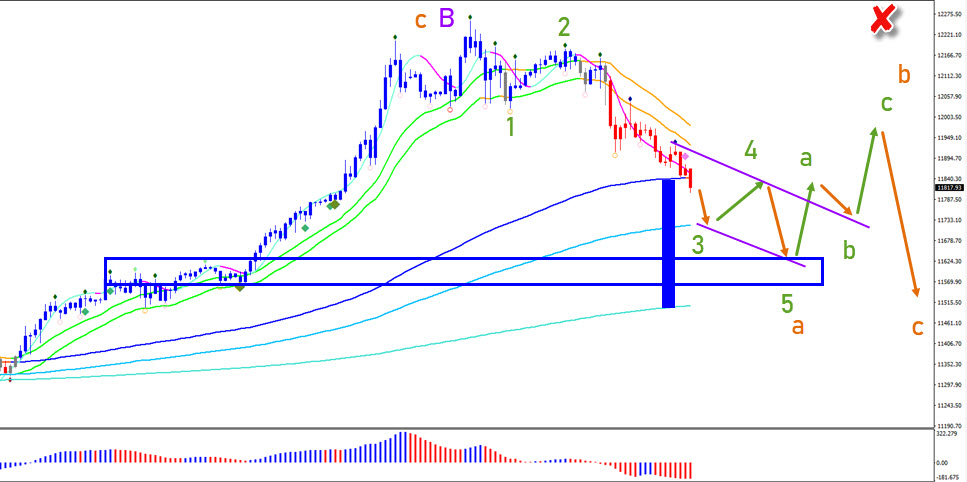
On the 1 hour chart, the bearish reversal is indicated by our Elliott Wave software via the red candles. The bears are now in full control of this time frame, but they will run into a strong and thick layer of support because of the moving averages (blue box).
Price action is expected to run out of steam at the support but it will create two more bottoms. This will complete a 5 wave (green) pattern. At that point, price action could finish the expected wave a (orange) and start an ABC pattern (green) in wave B (orange).
The analysis has been done with the indicators and template from the SWAT method (simple wave analysis and trading). For more daily technical and wave analysis and updates, sign-up to our newsletter.
Good trading,
Chris Svorcik


Leave a Reply