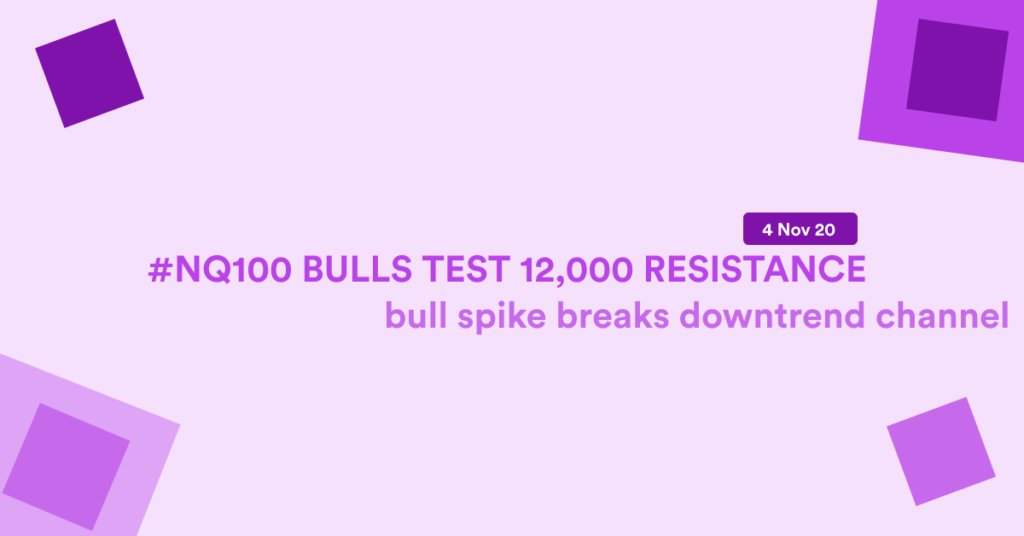
🔥 Nasdaq Charts Reveal ABCDE Triangle during 2020 US Elections 🔥
Dear traders,
the Nasdaq 100 (NQ100) made a bullish bounce at the support zone. The bulls continued up higher during the 2020 US Presidential elections.
This article reviews the expected price path of least resistance. We also analyse the wave patterns and outlook.
Price Charts and Technical Analysis
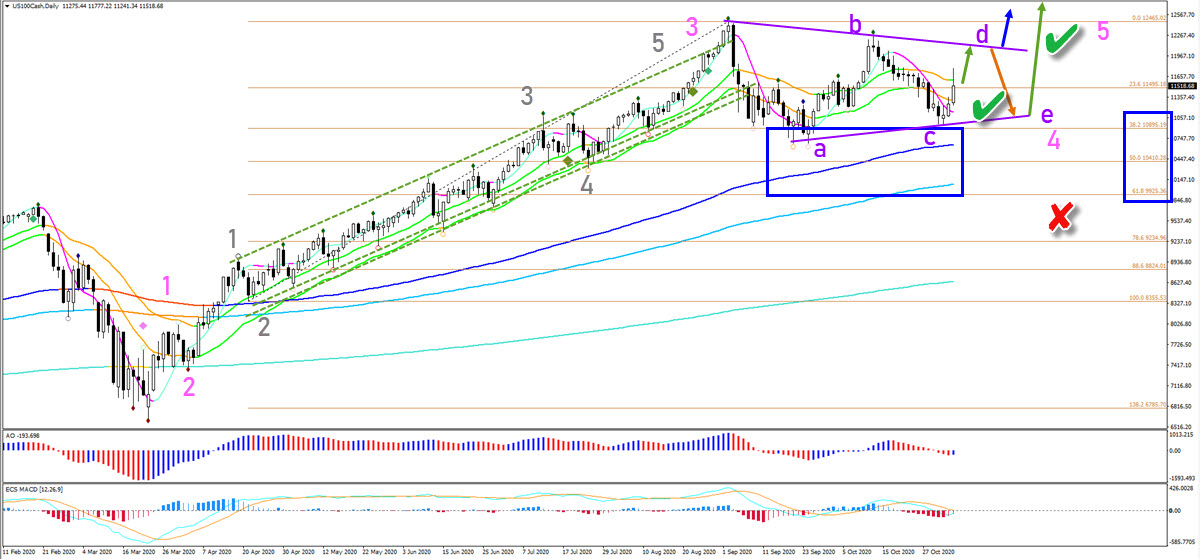
The NQ 100 bullish breakout (green arrow) is nearby. But a bearish bounce (orange arrow) is expected to take price action back down again. This would confirm a contracting triangle chart pattern.
The wave outlook would then indicate an ABCDE (purple) pattern. This would be within a wave 4 (pink). The breakout above the resistance confirms a wave 5 (pink).
The support zone remains strong and large. Only a break below the 61.8% Fibonacci retracement level invalidates (red x) the bullishness.
On the 4 hour chart, we see three completed price swings that confirm an ABC (purple) pattern. The main question is whether the current bullish swing will confirm a full uptrend OR whether price action will build an ABC (orange) pattern.
The main decision zone is the resistance (red box) and the deep 78.6% Fibonacci levels. An ABCDE pattern remains the favorite outlook.

The analysis has been done with the indicators and template from the SWAT method (simple wave analysis and trading). For more daily technical and wave analysis and updates, sign-up to our newsletter.
Good trading,
Chris Svorcik


Leave a Reply