? XAU/USD Pullback Before New Bullish Break and Uptrend ?
Subscribe
Hi traders,
XAU/USD (Gold) is now building a small triangle pattern but the previous price swing showed strong bullish momentum. An uptrend continuation is likely to occur soon.
Gold – XAU/USD
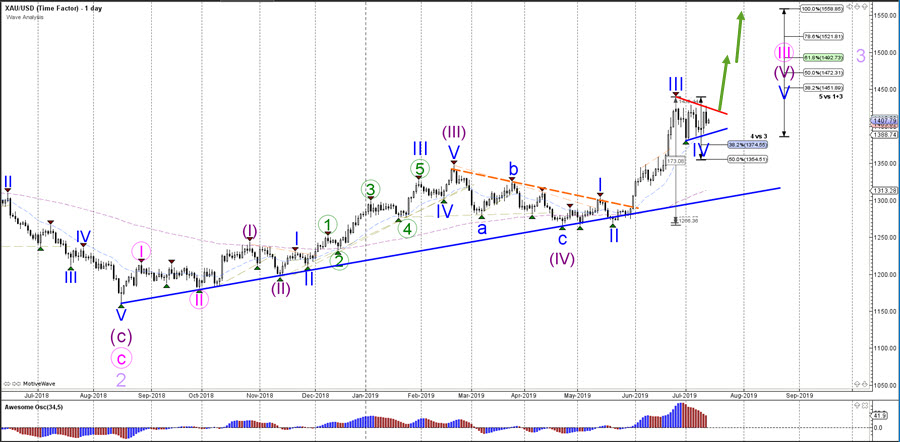
Daily
The XAU/USD triangle chart pattern is respecting the shallow Fibonacci retracement levels of wave 4 vs 3 which is typical behavior for a wave 4 (blue) pattern. A bullish breakout above the resistance trend line (red) would confirm the uptrend continuation towards the Fibonacci targets of waves 5 whereas an unexpected break below the 50% Fib would indicate that the bullish momentum is losing its steam. At the moment a new bull run on XAU/USD is becoming increasingly more likely.
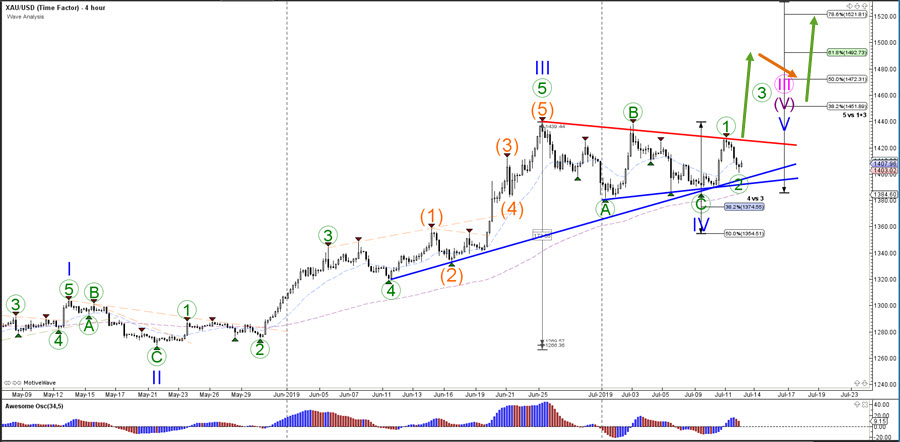
4 hour
The XAU/USD seems to have completed a bearish ABC pattern (green) within the wave 4 (blue) pattern. The recent bullish momentum is probably indicating the restart of the uptrend via wave 1 (green). The current pullback is therefore a wave 2 (green) as long as price stays do not break below the bottom of wave 1, which would invalidate the wave 1-2 pattern (green). The same idea is valid for this chart as well: a bullish breakout could indicate the start of an uptrend via a potential wave 3 (green) pattern.
For more daily wave analysis and updates, sign-up up to our ecs.LIVE channel.
Good trading,
Chris Svorcik
Elite CurrenSea


Leave a Reply