Weekly Waves: Bitcoin Bearish Reversal Plus EUR/USD & GBP/AUD Daily Charts
January 5, 2022
4 min read
Subscribe

Hi Traders,
the Bitcoin (BTC/USD) weekly chart is showing a potential bearish reversal. The uptrend could be completed after 5 bullish waves up.
We also review the EUR/USD downtrend and GBP/AUD triangle pattern on the daily charts.
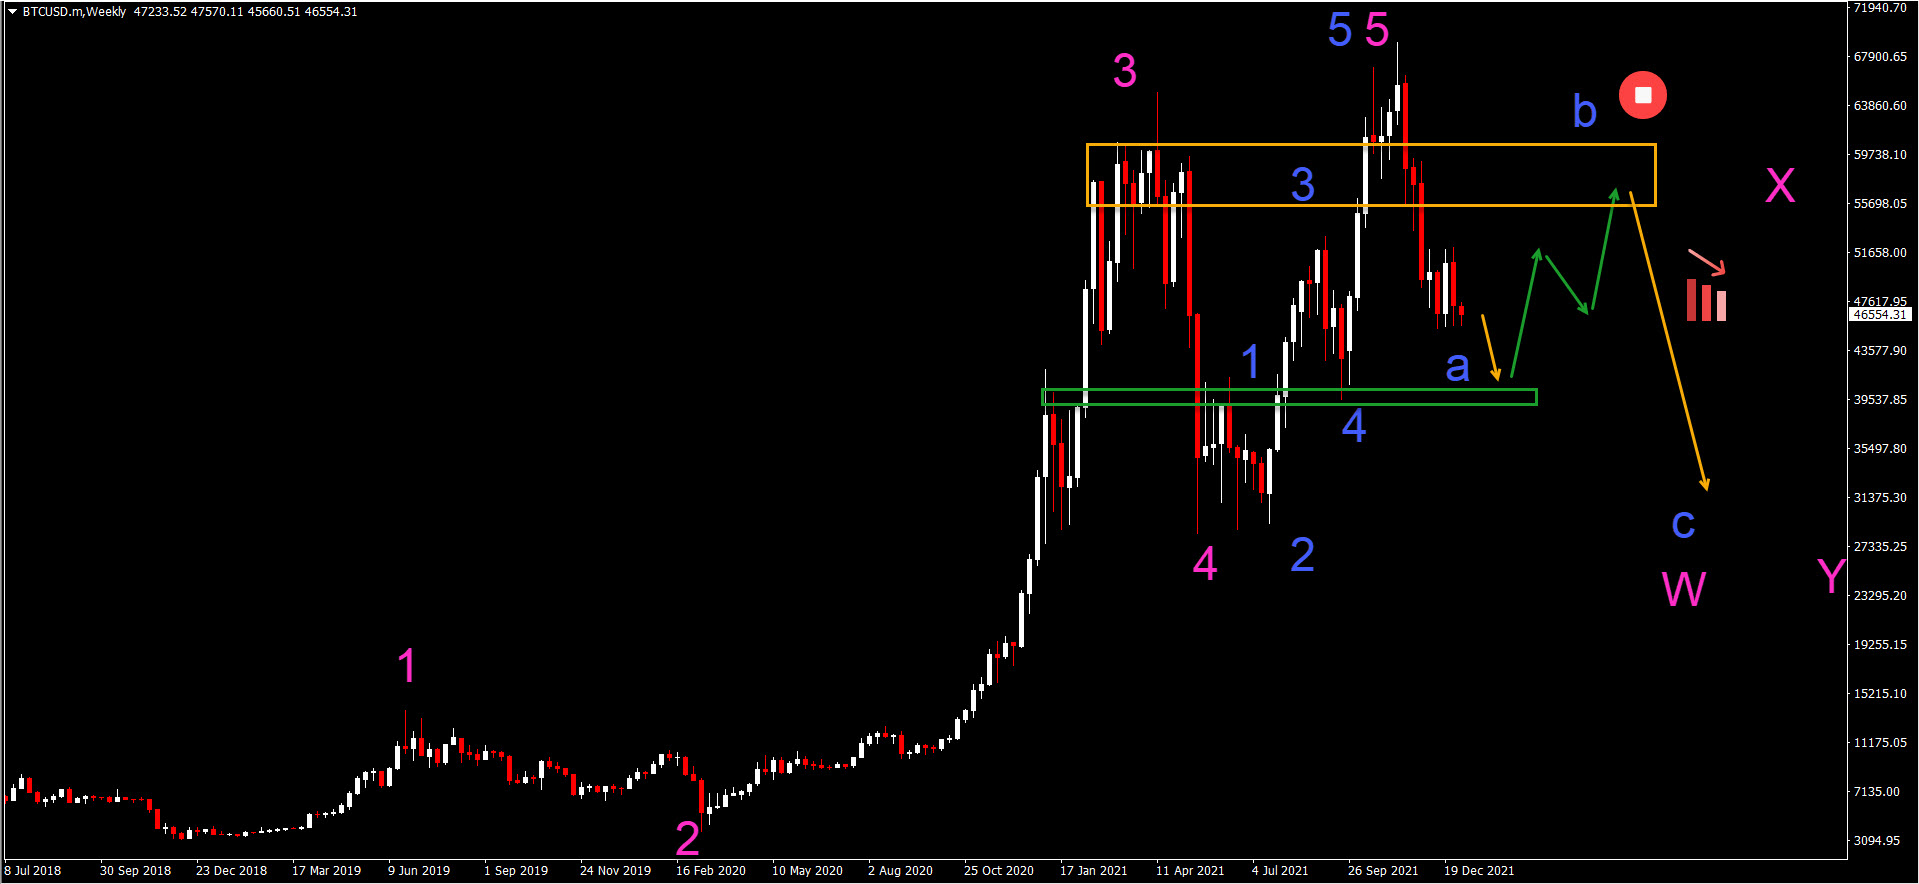
Bitcoin Bearish Momentum vs Uptrend
The BTC/USD chart remains in an uptrend but the bearish pressure is placing it under severe pressure. The higher high was quickly followed by a fast decline:
- A 5 wave (pink) pattern seems to be completed. There is also a clear 5 wave pattern (blue) in the final 5th wave (pink).
- Price made a higher high but the bulls were unable to hold ground. The quick bearish decline showed a lot of bearish momentum. The bearish drop could be a wave A (blue).
- A new lower low is expected (orange arrow) to test the support zone (green) first. A bullish bounce (green arrow) could test the resistance zone (orange).
- A bearish bounce at the resistance would confirm that the uptrend is indeed over.
- A larger, complex bearish correction could take place via a WXY (pink) pattern. In case, the uptrend continues, then it is likely that a triangle pattern will emerge first.
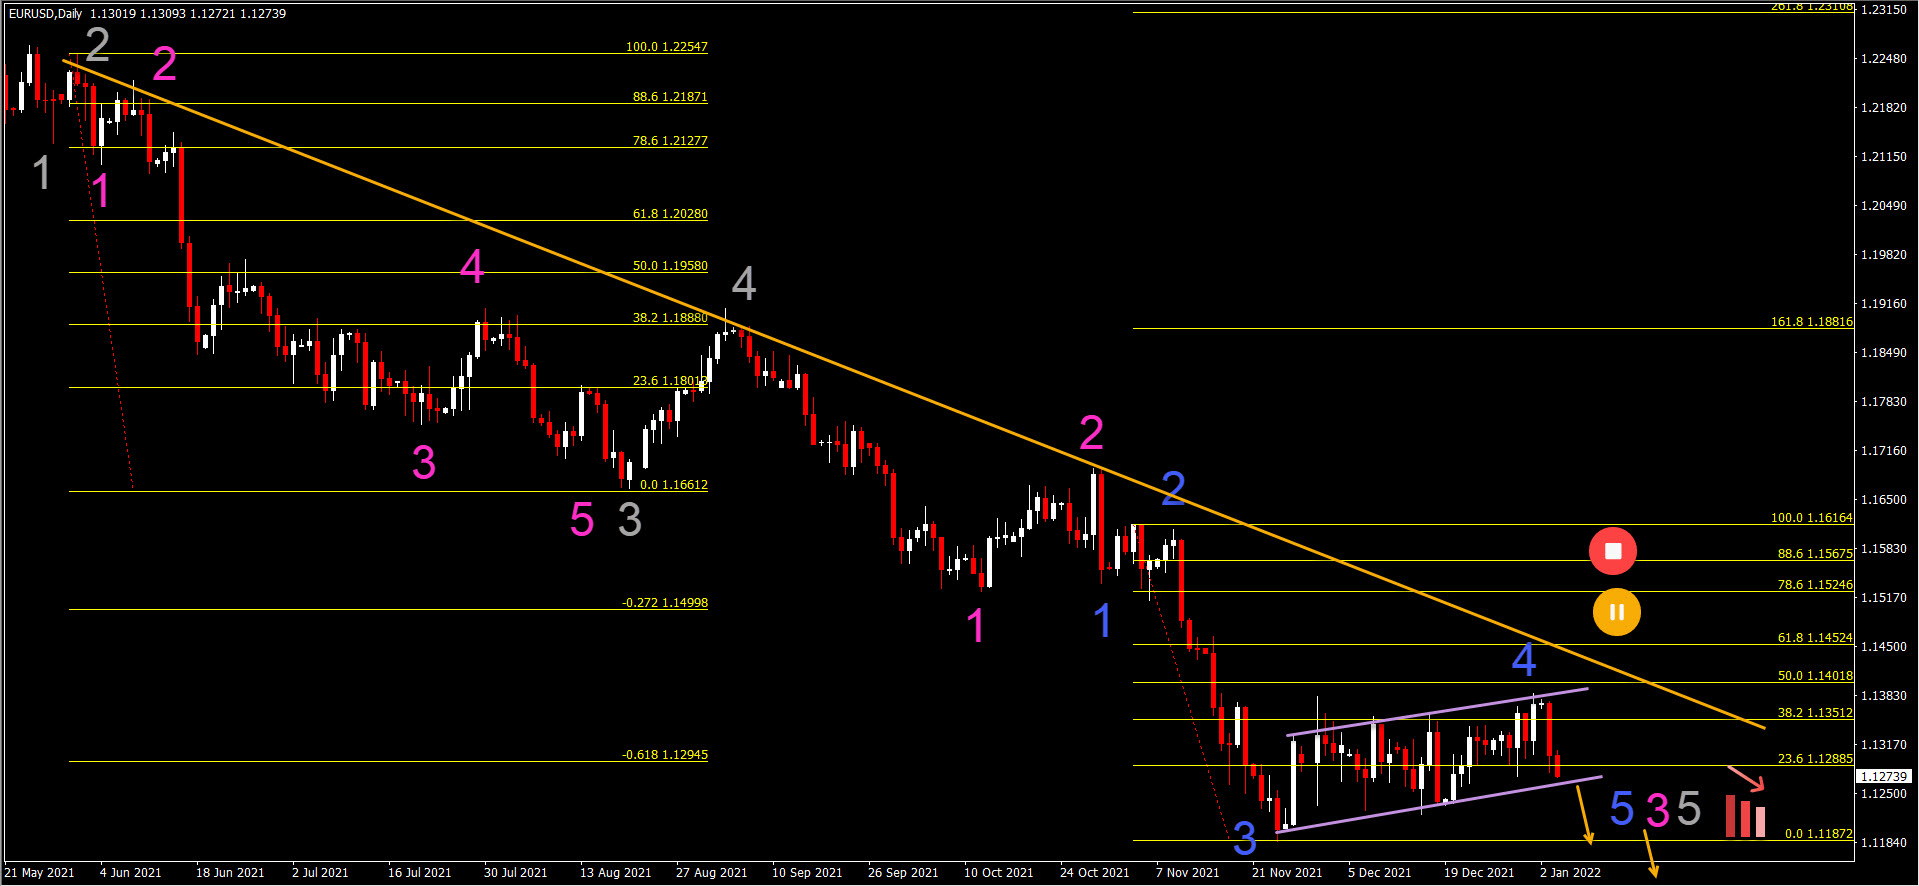
EUR/USD Downtrend Continuation
The EUR/USD downtrend is strong. The resistance trend line (orange) indicates how long the bears have been in control:
- The current decline is a bearish impulsive wave. There seem to be 5 waves (grey) developing at the moment.
- The current pullback is probably a bear flag (purple lines) within the wave 4 (blue). This is invalid if the retracement breaks above the 78.6% Fibonacci level. A break below (orange arrow) the flag confirms the downtrend continuation.
- The main target for the downtrend is the round level of 1.10.
- The downtrend could be part of a wave 5 (blue) of wave 3 (pink) of wave 5 (grey).
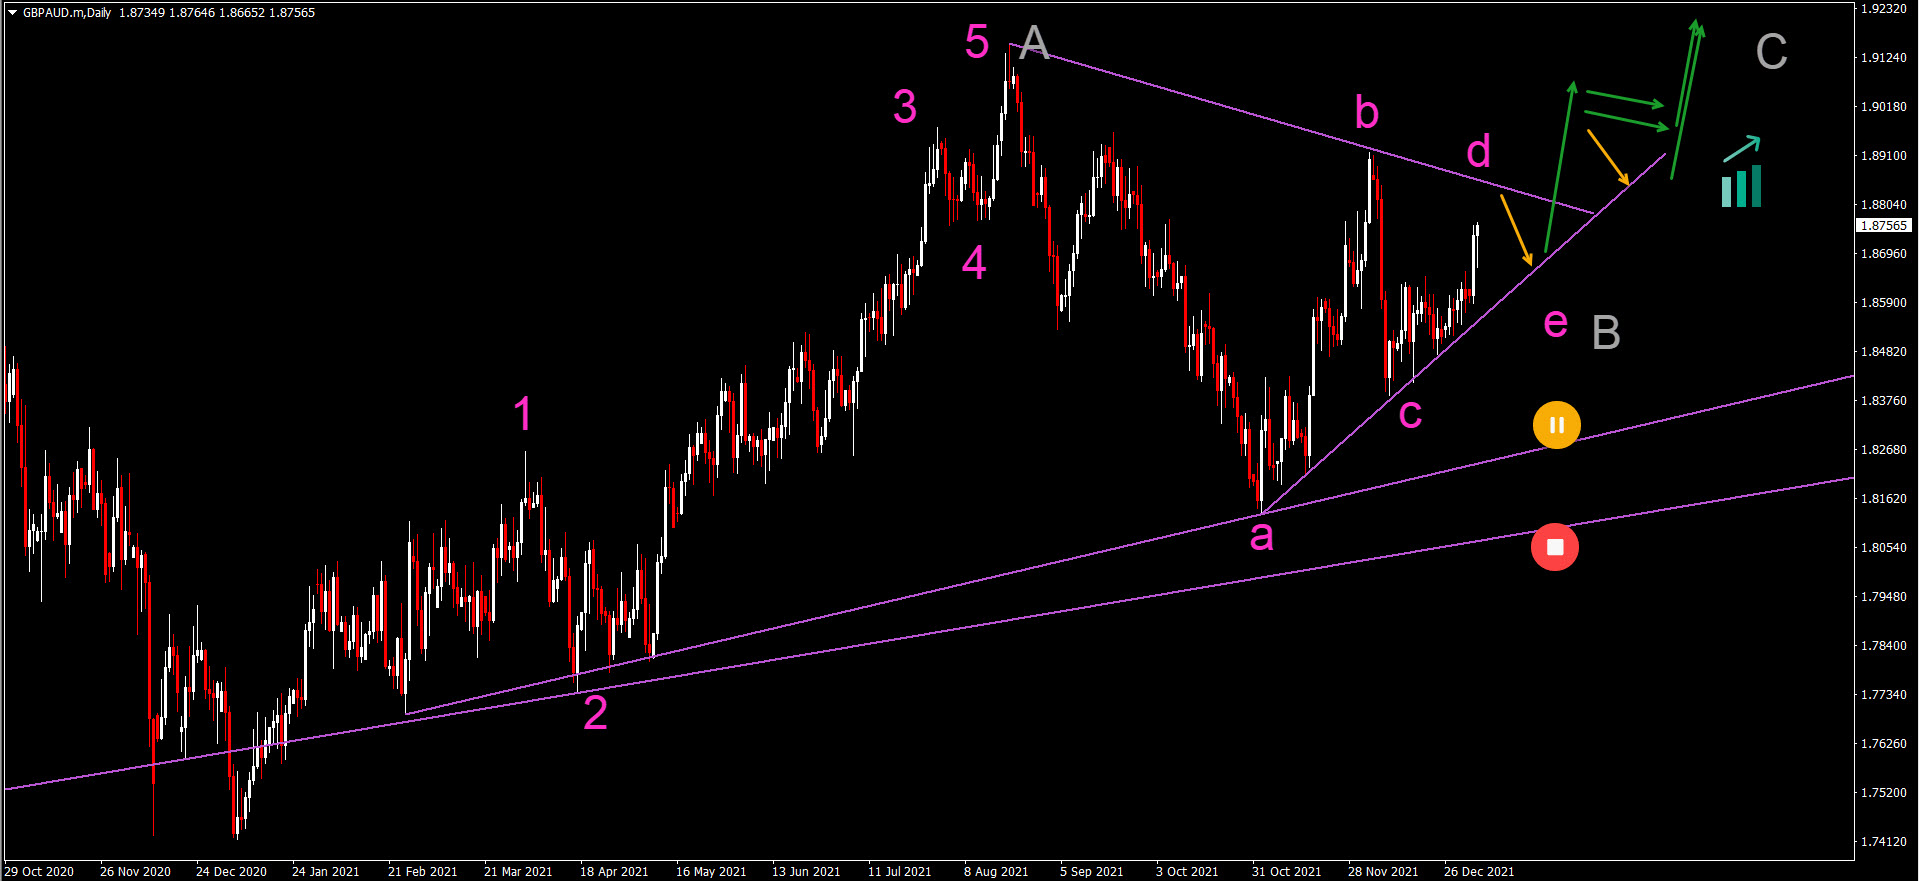
GBP/AUD In Consolidation
The GBP/AUD chart is showing an uptrend with support trend lines (purple) below the current price:
- After 5 waves up (pink), price is making a consolidation. The correction could be an ABCDE (pink) pattern.
- The current outlook remains valid if price action stays above the bottoms.
- A break above the resistance trend line could spark a bullish breakout and rally.
Good trading,
Chris Svorcik


Leave a Reply