Weekly Waves 26 Apr: EUR/USD, Bitcoin and US30
April 26, 2022
4 min read
Subscribe
Hi Traders,
our weekly Elliott Wave analysis reviews the EUR/USD daily chart, the Bitcoin crypto currency daily chart, and US30 on the weekly chart.
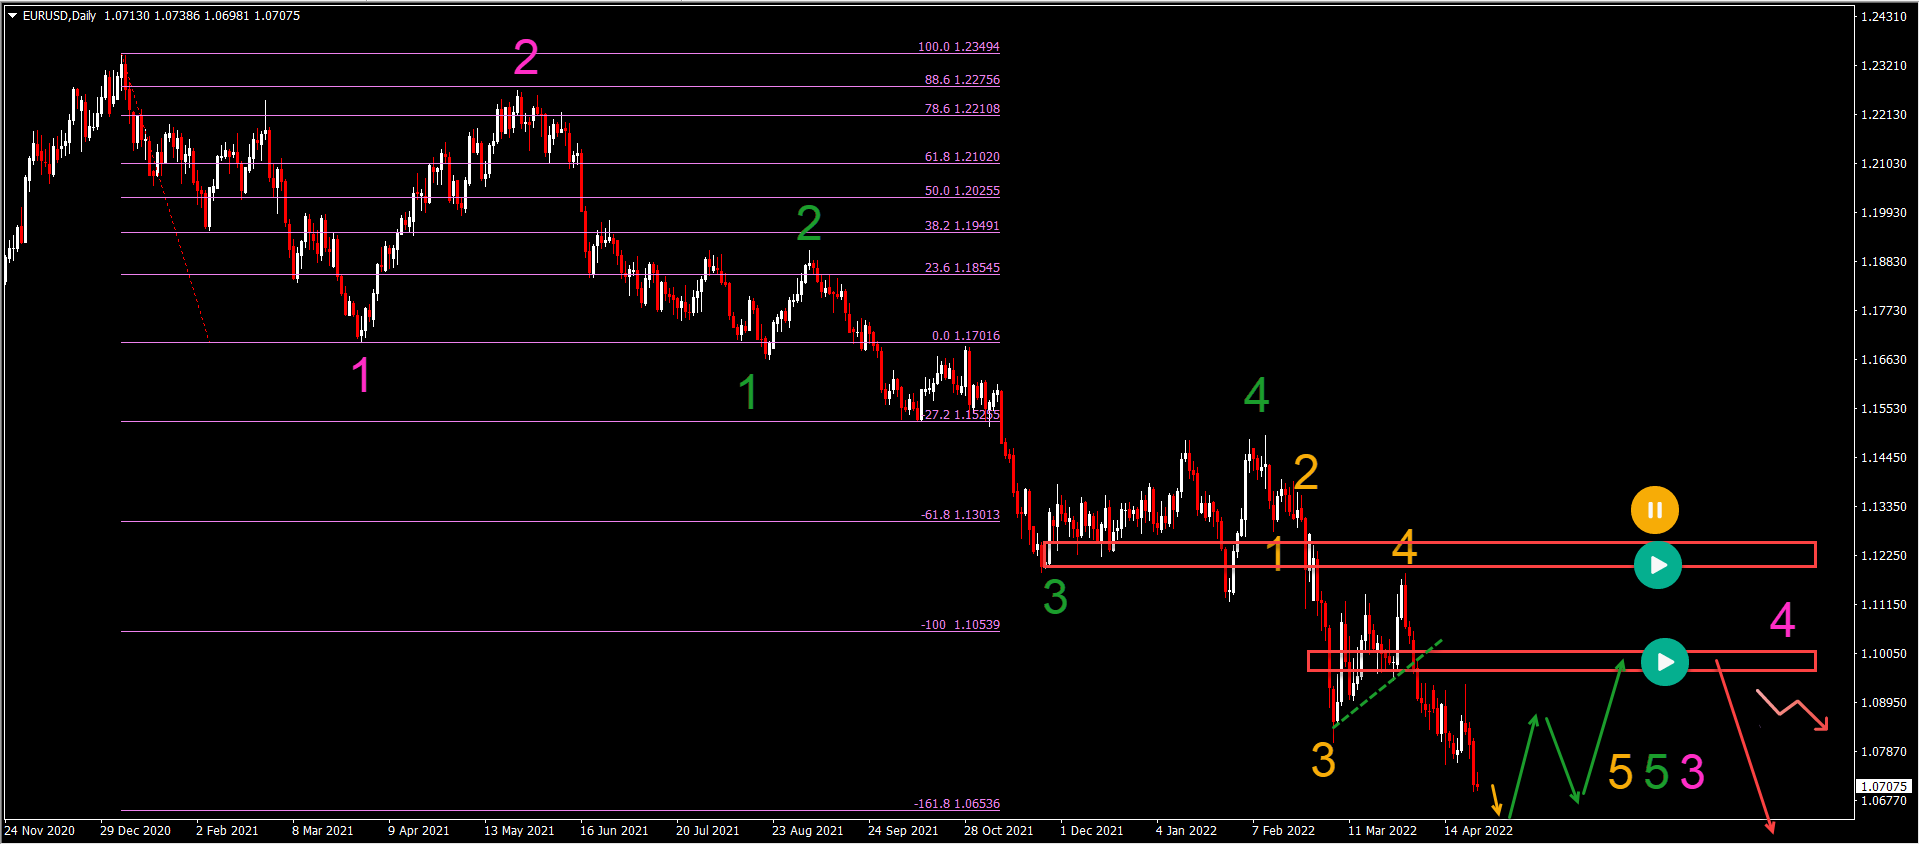
EUR/USD Confirms Bearish Wave 3 Pattern
The EUR/USD made a key bearish breakout below the support trend line (dotted green). Let’s review what the breakout indicates:
- The EUR/USD is now in a wave 3 (pink) rather than a wave C because price action is approaching the -161.8% Fibonacci target.
- The -161.8% Fibonacci target could be a bouncing spot. The strength of the bounce will depend if the wave 3 (pink) will complete at this target or the -200% Fib target.
- A strong bullish bounce could indicate the end of wave 3 (pink) and the start of wave 4 (pink).
- A mild bullish reaction indicates that the wave 3 (pink) is still developing and a bearish breakout should see price towards 1.05, 1.04, 1.025, and 1.00.
- A bullish retracement should usually be shallow which is usual for waves 4. The resistance boxes (red) are expected to stop price action from moving any higher.
ATHENA EA
#H1
#H4
#Time frames
Award Winning Momentum TradingPromo
Yearly Target:
220%
Risk/Reward:
0.36
Platforms:
MT4
Historical Drawdown:
30%
Min. Deposit:
50$
Asset Types:
Forex

Presented by
Chris Svorcik
Verified on:
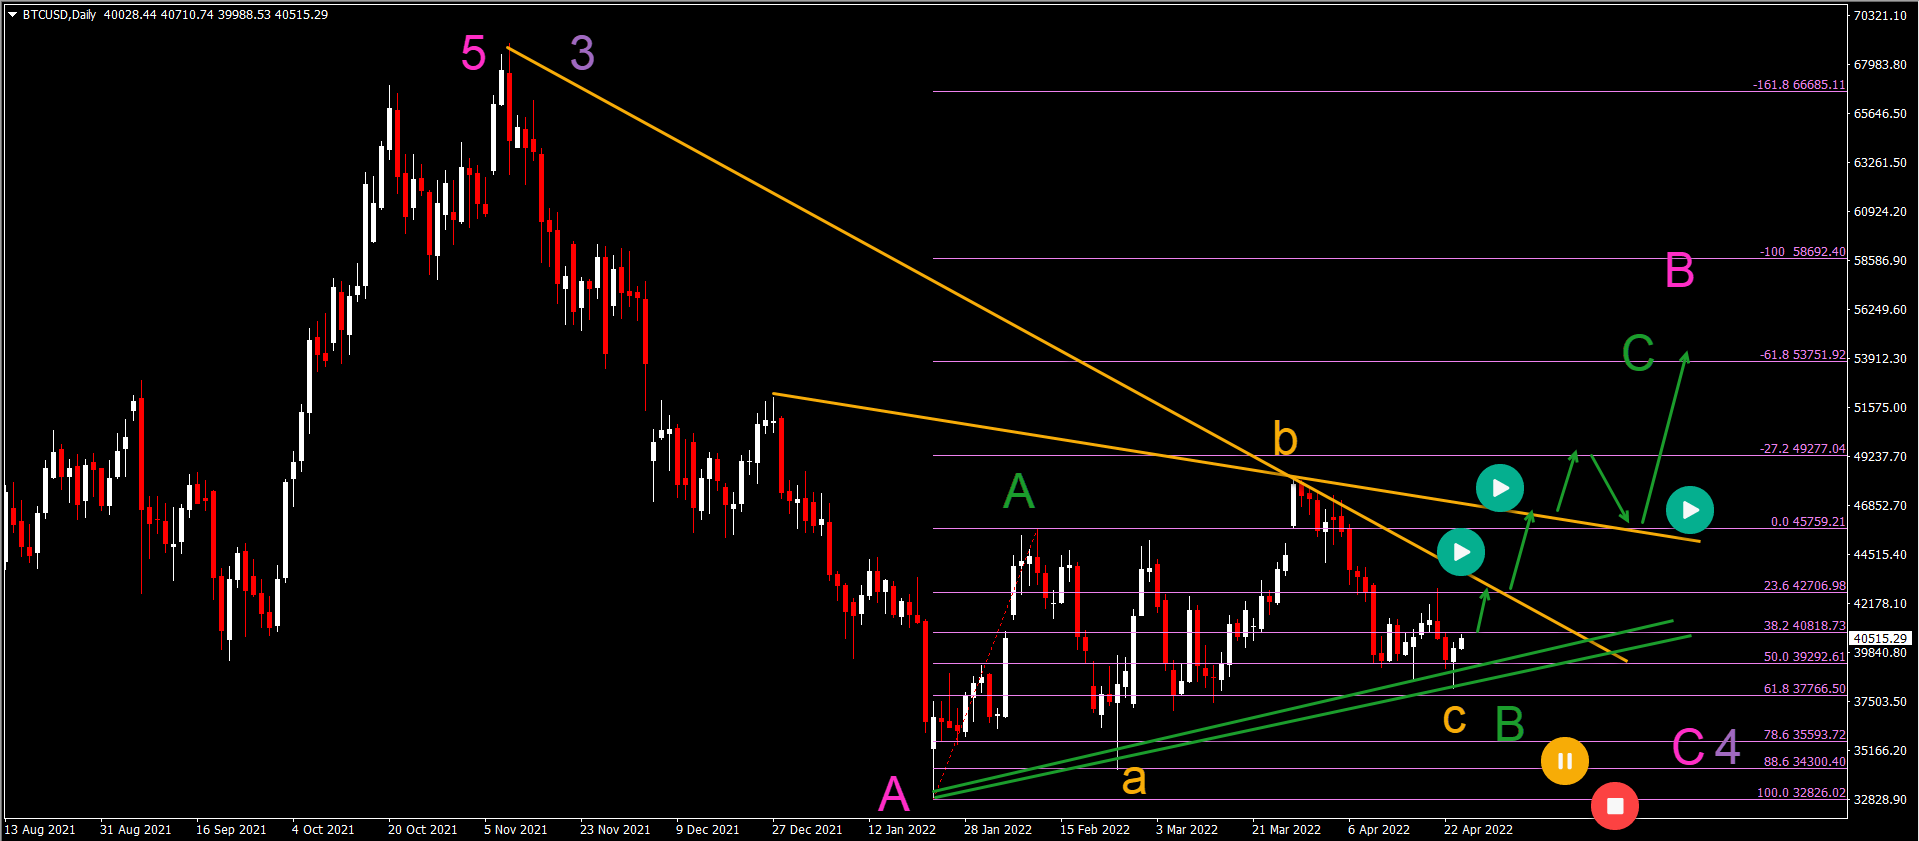
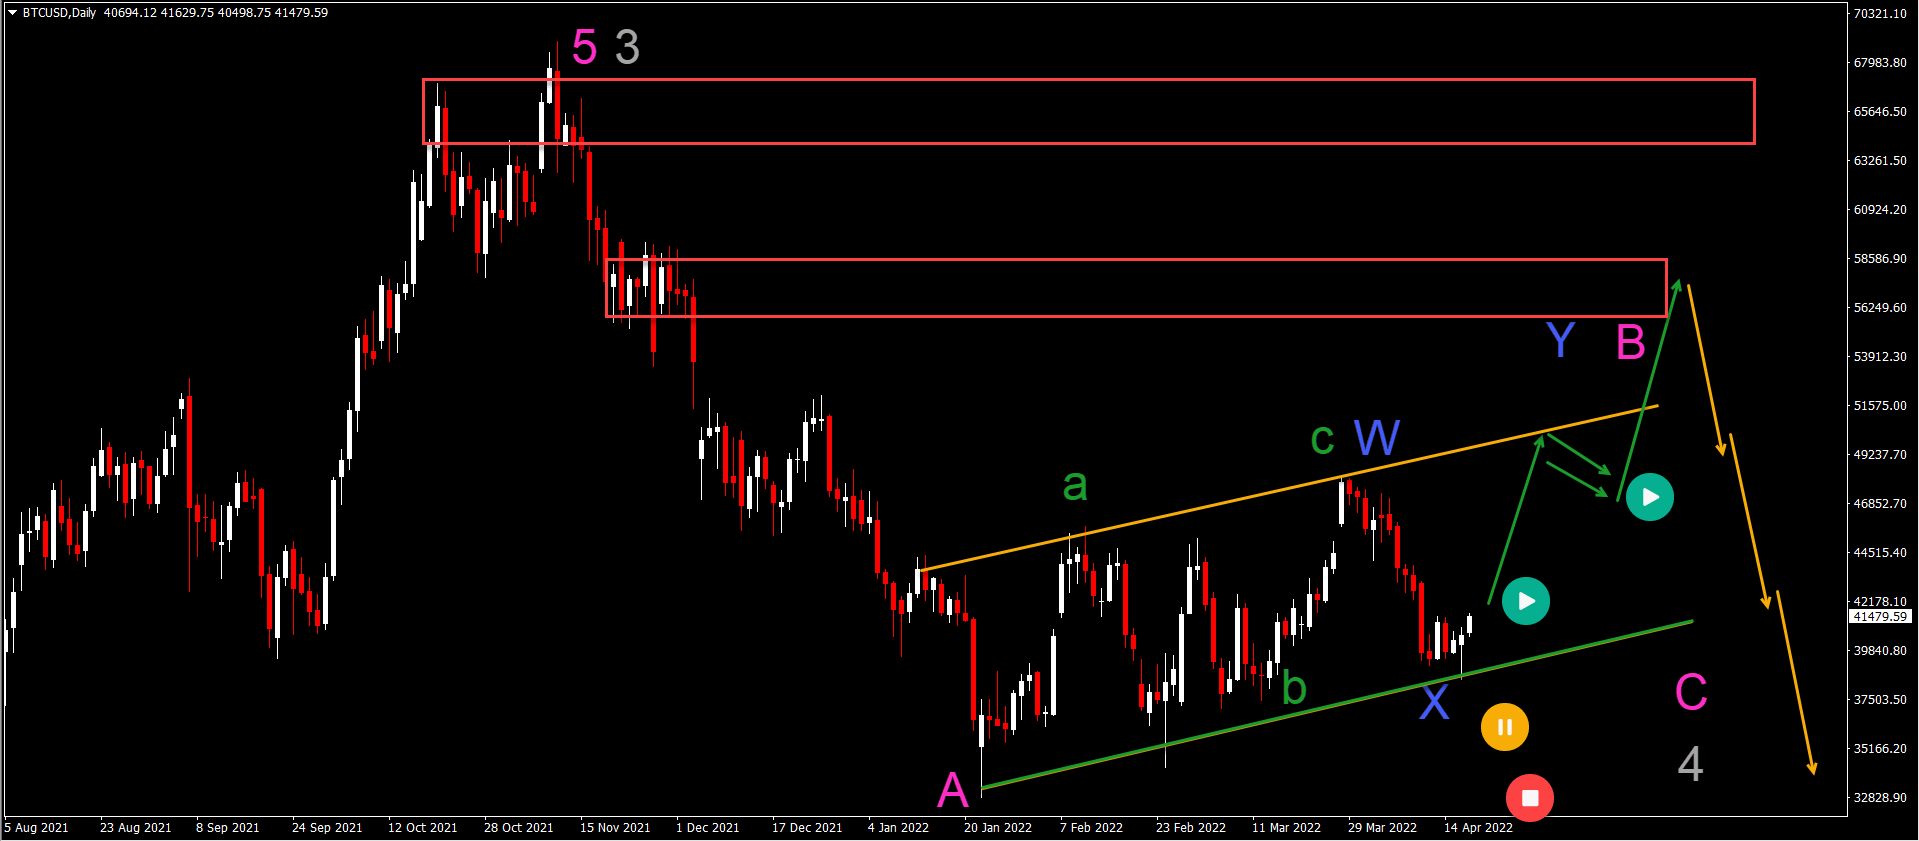
BTC/USD Bullish Pinbar Confirms Double Bottom?
Bitcoin (BTC/USD) has printed another bullish candlestick pinbar:
- The BTC/USD bullish pinbar is the second one in recent history and offers a double bottom pattern at the support trend lines (green).
- We changed our Elliott Wave analysis to a bearish ABC (orange) pattern within wave B (green), compared to last week.
- Now price action is expected to make a bullish bounce within wave C (green). The Fibonacci levels are the main targets.
- A breakout above the resistance trend lines (orange) would confirm the development within that wave C (green).
- A larger ABC (pink) corrective pattern is expected within wave 4 (purple).
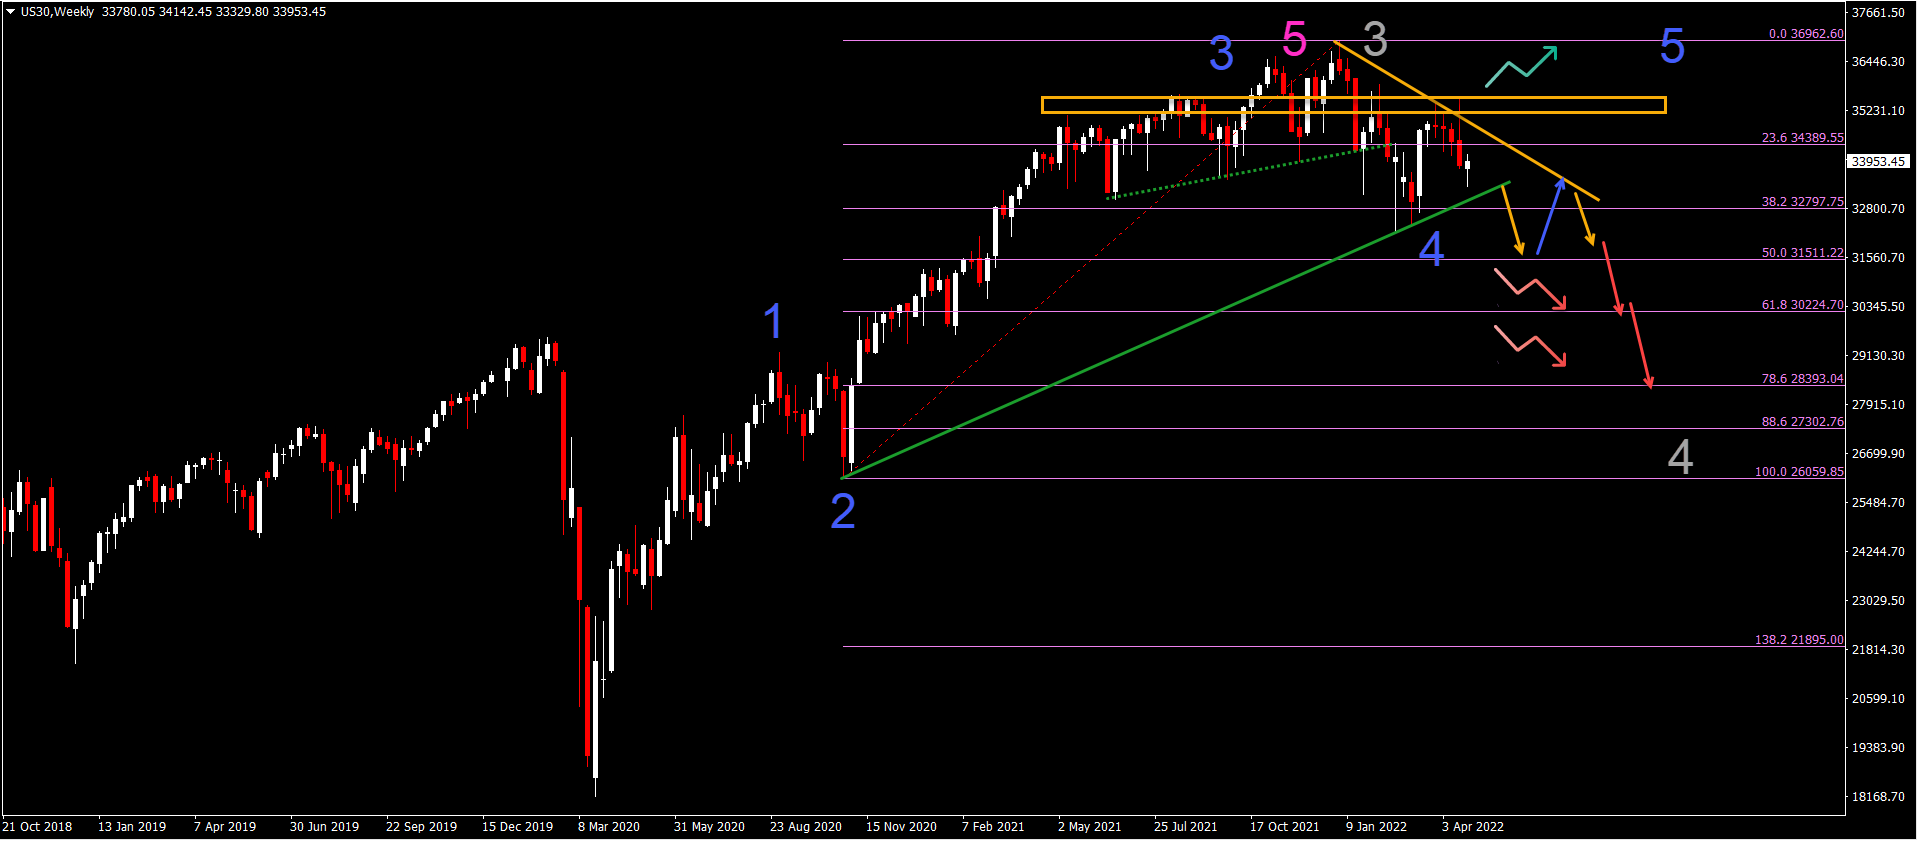
US30 Index Sinks Again at Heavy Resistance
The US30 made a strong bearish bounce at the resistance zone. Let’s review what it means for the US30 chart:
- The US30 weekly chart was unable to break above the resistance zone (orange). In fact, price action showed a strong bearish rejection (bearish weekly candle).
- The bearish rejection confirms a lower high. Price action already made several lower lows so a downtrend is already established.
- That said, the angle of the trend is still shallow and could easily fit within a wave 4 pattern.
- For a stronger and more serious downtrend to be confirmed, price action will need to break below the support trend line (green).
- Eventually a retest and break below the 50% Fibonacci is needed before a clear bearish reversal is expected (red arrows).
- The uptrend (green arrow) is only a factor if price action is able to break above the resistance box (orange).
Good trading,
Chris Svorcik


Leave a Reply