Weekly Waves 24 October: EUR/USD, Bitcoin and Gas
October 24, 2022
4 min read
Hi Traders,
Our weekly Elliott Wave analysis reviews the EUR/USD daily chart, the Natural Gas daily chart, and the Bitcoin weekly chart.
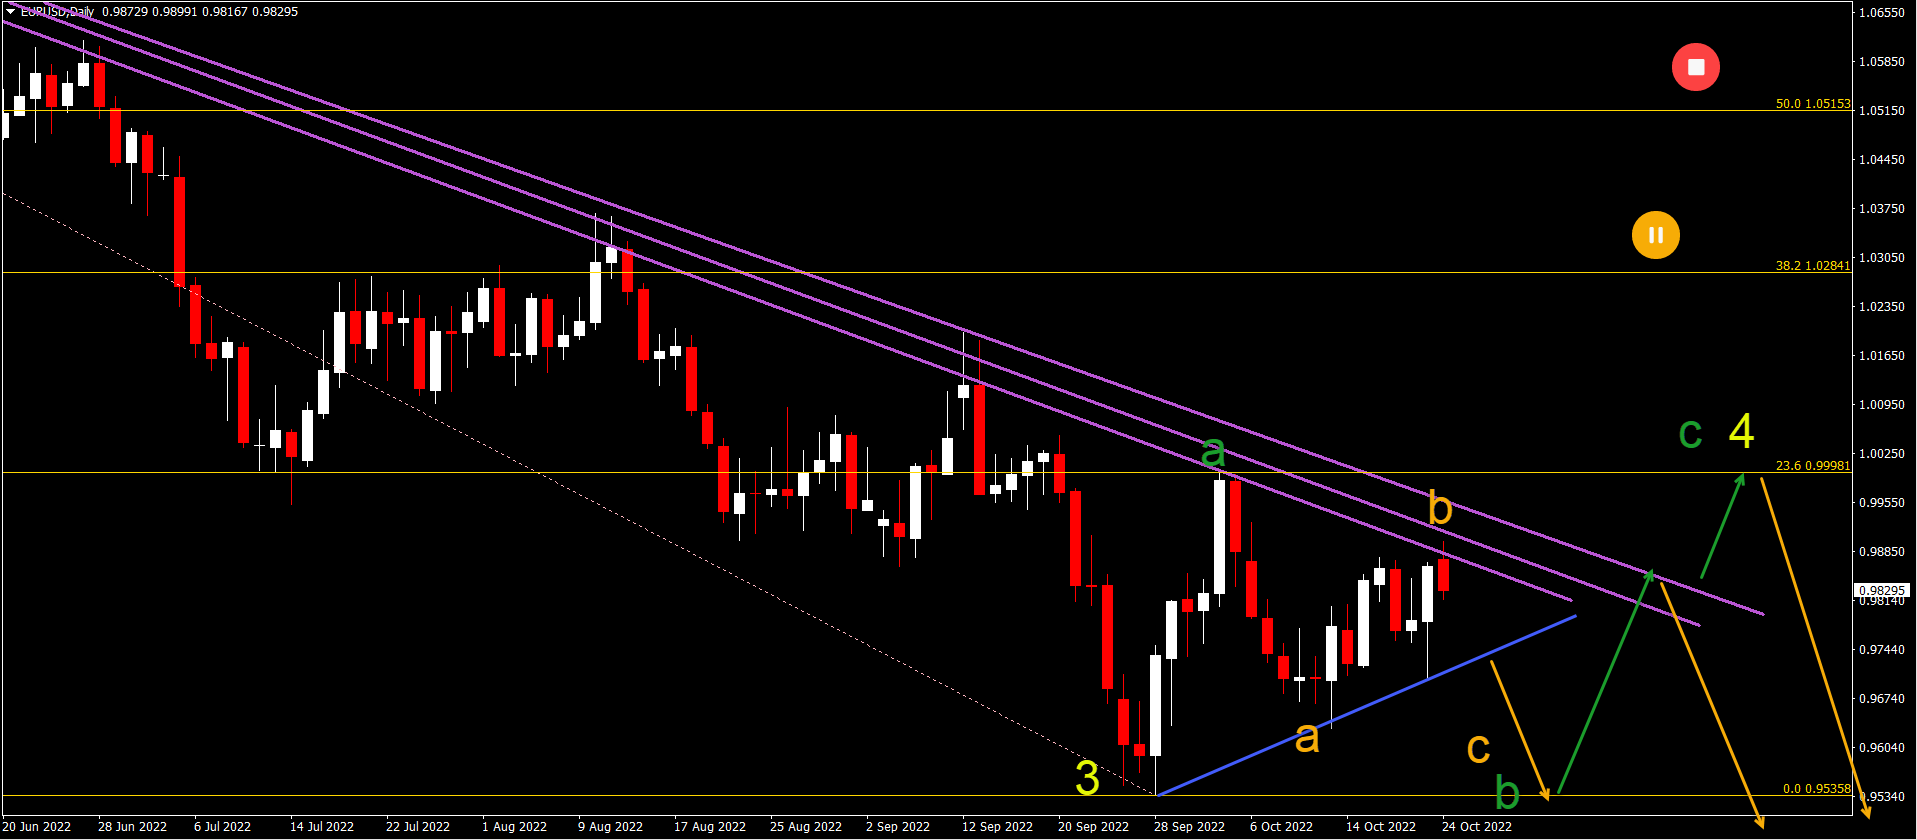
EUR/USD Trapped Between 0.95 and 1.00
The EUR/USD remains trapped between the 0.95 support level and parity (1.00) resistance zone:
- The EUR/USD did make a bullish bounce (wave A orange) as expected.
- But the bullish rebound was milder than we anticipated. Therefore, we changed the expected Elliott Wave pattern to a bearish ABC (orange).
- Another bounce at the previous bottom near 0.95 could confirm the end of wave B (green) and the start of wave C (green).
- The wave C could end up as a bullish 5 wave pattern finishing at the previous top near the 23.6% Fibonacci level.
- A downtrend continuation is expected once the ABC (green) completes the wave 4 (yellow).
ATHENA EA
#H1
#H4
#Time frames
Award Winning Momentum TradingPromo
Yearly Target:
220%
Risk/Reward:
0.36
Platforms:
MT4
Historical Drawdown:
30%
Min. Deposit:
50$
Asset Types:
Forex

Presented by
Chris Svorcik
Verified on:
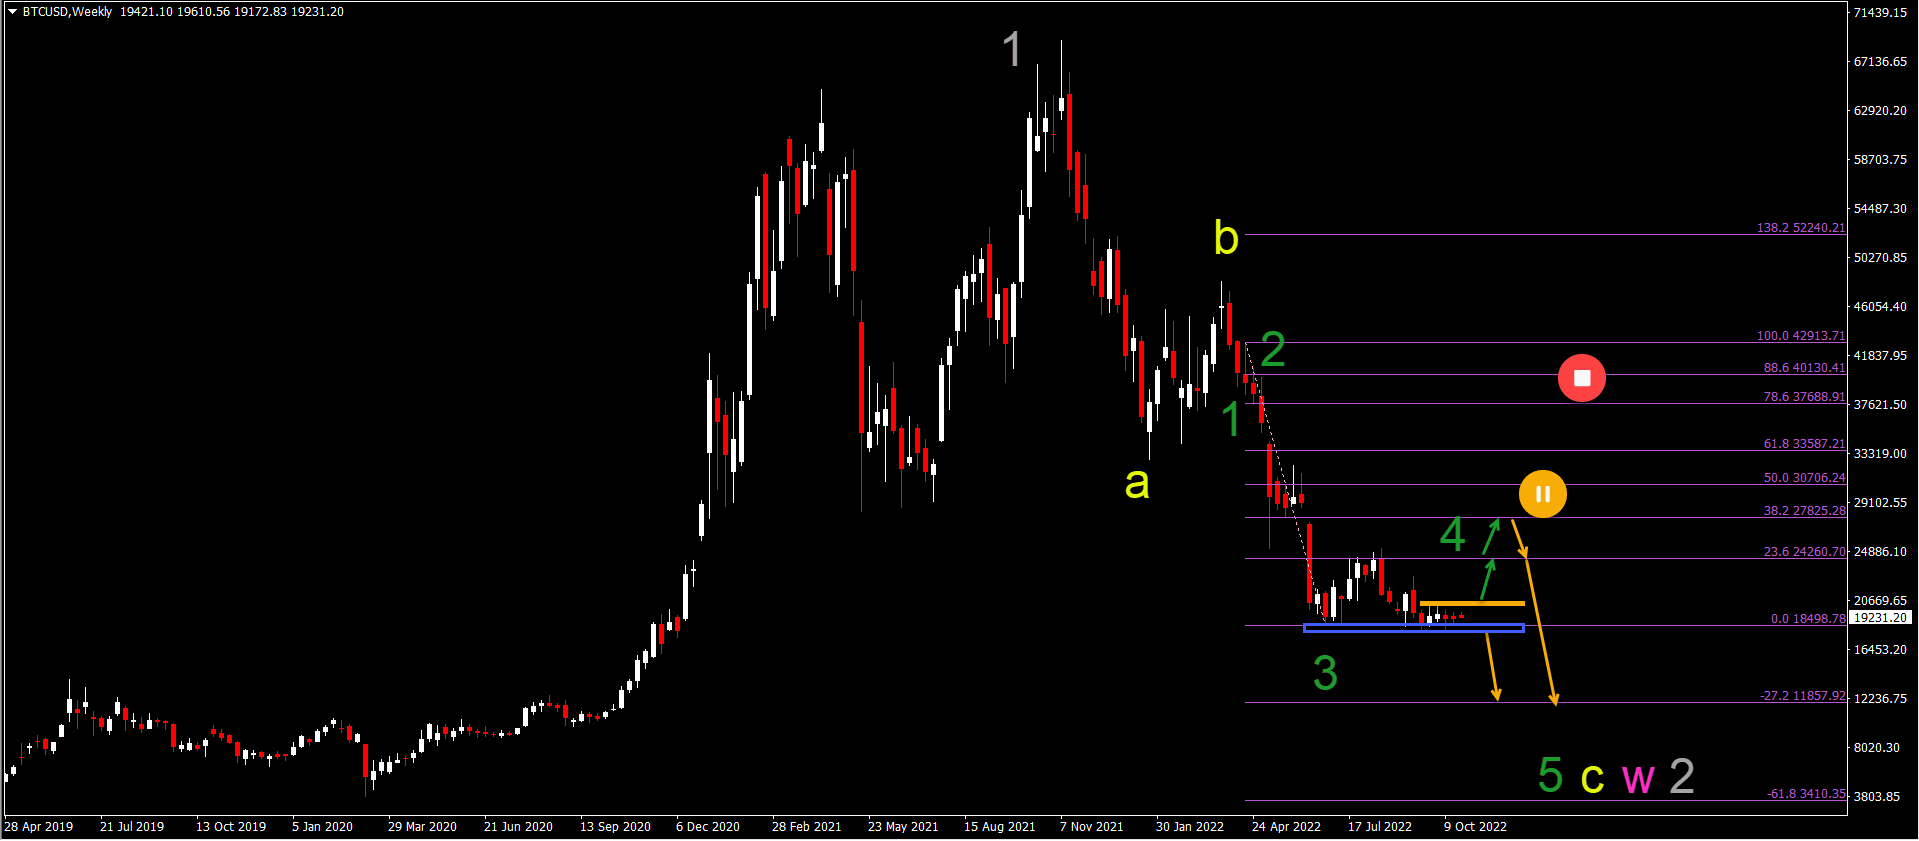
Bitcoin
Bitcoin (BTC/USD) is moving sideways between $19k and $20 resistance:
- BTC/USD is awaiting a break up or down.
- A bearish breakout (orange arrow) below the support zone (blue) could confirm a drop towards the $15k and $12k support zones.
- A bullish breakout (orange arrows) above the $20 resistance zone (orange) could indicate a retracement towards the 23.6% and 38.2% Fibonacci levels.
- A deeper bullish push upwards places this bearish Elliott Wave analysis on hold.
- The bearish swing could complete a wave 5 (green) of wave C (yellow) of a wave W (pink) of wave 2 (gray).
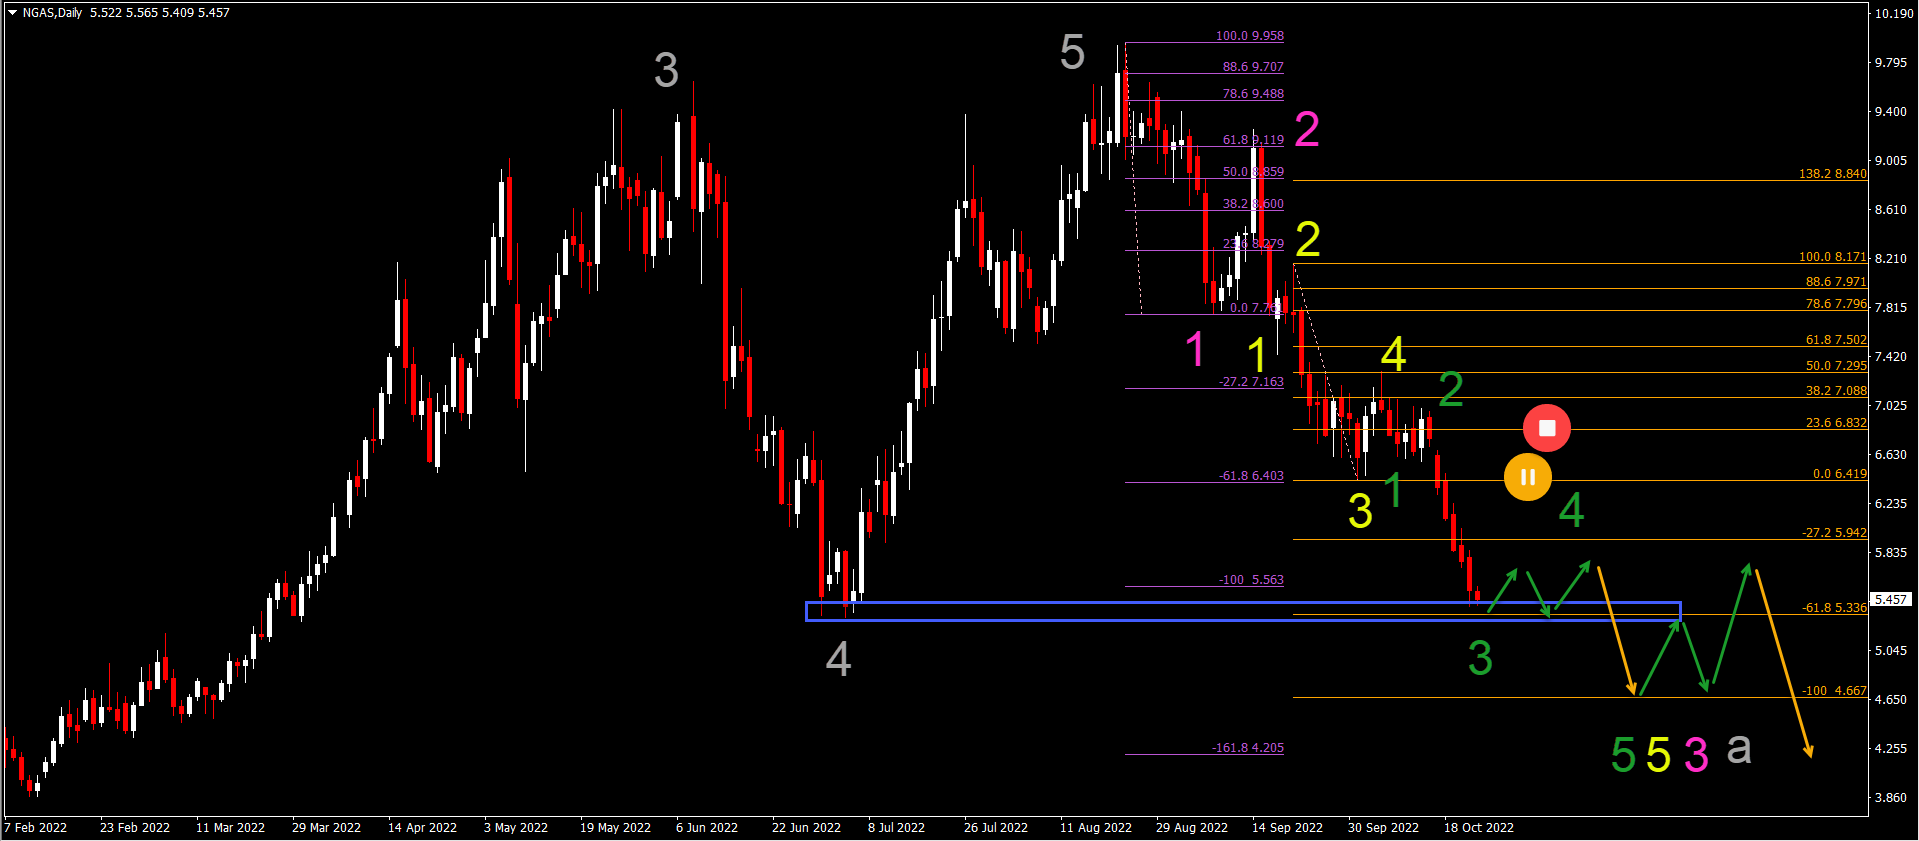
NGAS Strong Bearish Drop Approaches $5 Support
NGAS is dropping lower quickly as we anticipated last week:
- The bearish decline has been marked as a wave 3 (green).
- Price action could however stop at the support zone (blue) and make a bounce.
- A mild bullish correction marks the end of wave 3 (green) and the start of wave 4 (green).
- A bearish breakout (orange arrow) below the corrective pattern indicates a downtrend continuation towards the next Fibonacci target.
- This could complete wave 5 (green) of wave 5 (yellow) of wave 3 (pink) of A (gray).
- A deeper bullish retracement above $6.4 places this bearish Elliott Wave analysis on hold.
Good trading,
Chris Svorcik


Leave a Reply