Weekly Waves 22 August: EUR/USD, GBP/USD and Bitcoin
August 22, 2022
4 min read

Hi Traders,
Our weekly Elliott Wave analysis reviews the EUR/USD monthly chart, the GBP/USD 4 hour chart, and the Bitcoin crypto currency weekly chart.
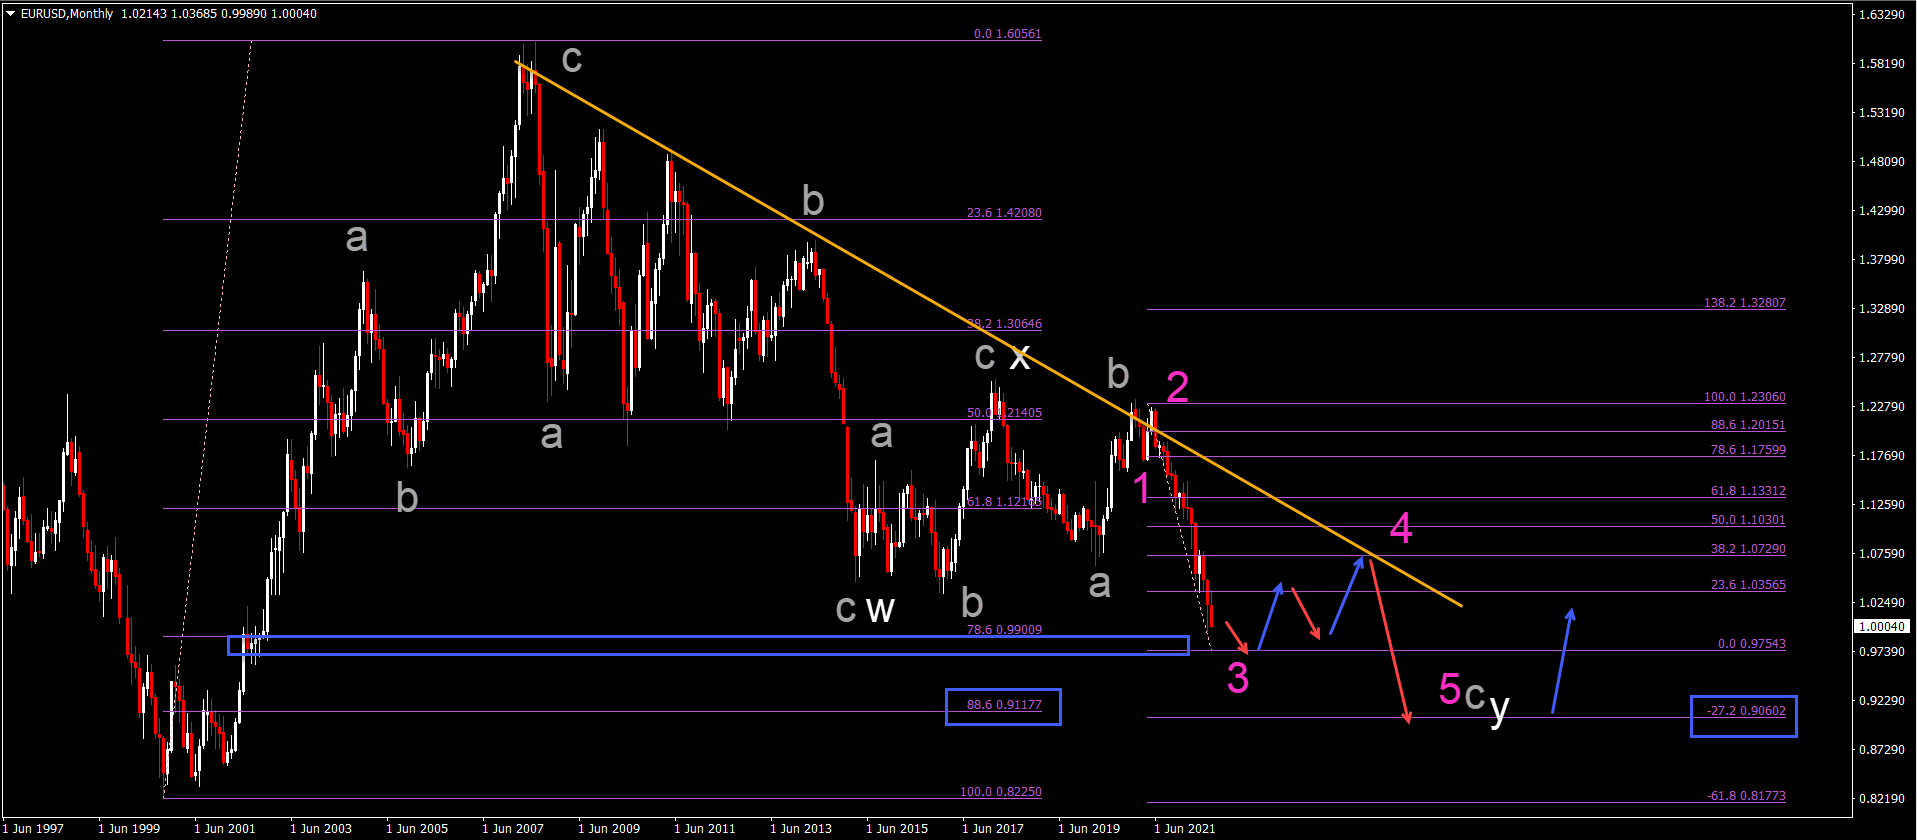
EUR/USD Testing Key Support Zone at 0.9750
The EUR/USD is testing again the key parity (1.00) level:
- The EUR/USD is expected to decline further but a larger support zone and 78.6% Fibonacci level (blue box) could stop the downtrend around 0.9750.
- A bullish reaction at the support zone could indicate a larger bullish correction within the wave 4 (pink).
- The bullish rebound could take price back up the 23.6% and 38.2 Fibonacci retracement levels plus resistance trend line.
- Eventually a bearish continuation is expected towards the 88.6% Fibonacci retracement level and -27.2% Fibonacci target.
- A bearish breakout below the support 0.9750 indicates an immediate continuation lower.
ATHENA EA
#H1
#H4
#Time frames
Award Winning Momentum TradingPromo
Yearly Target:
220%
Risk/Reward:
0.36
Platforms:
MT4
Historical Drawdown:
30%
Min. Deposit:
50$
Asset Types:
Forex

Presented by
Chris Svorcik
Verified on:
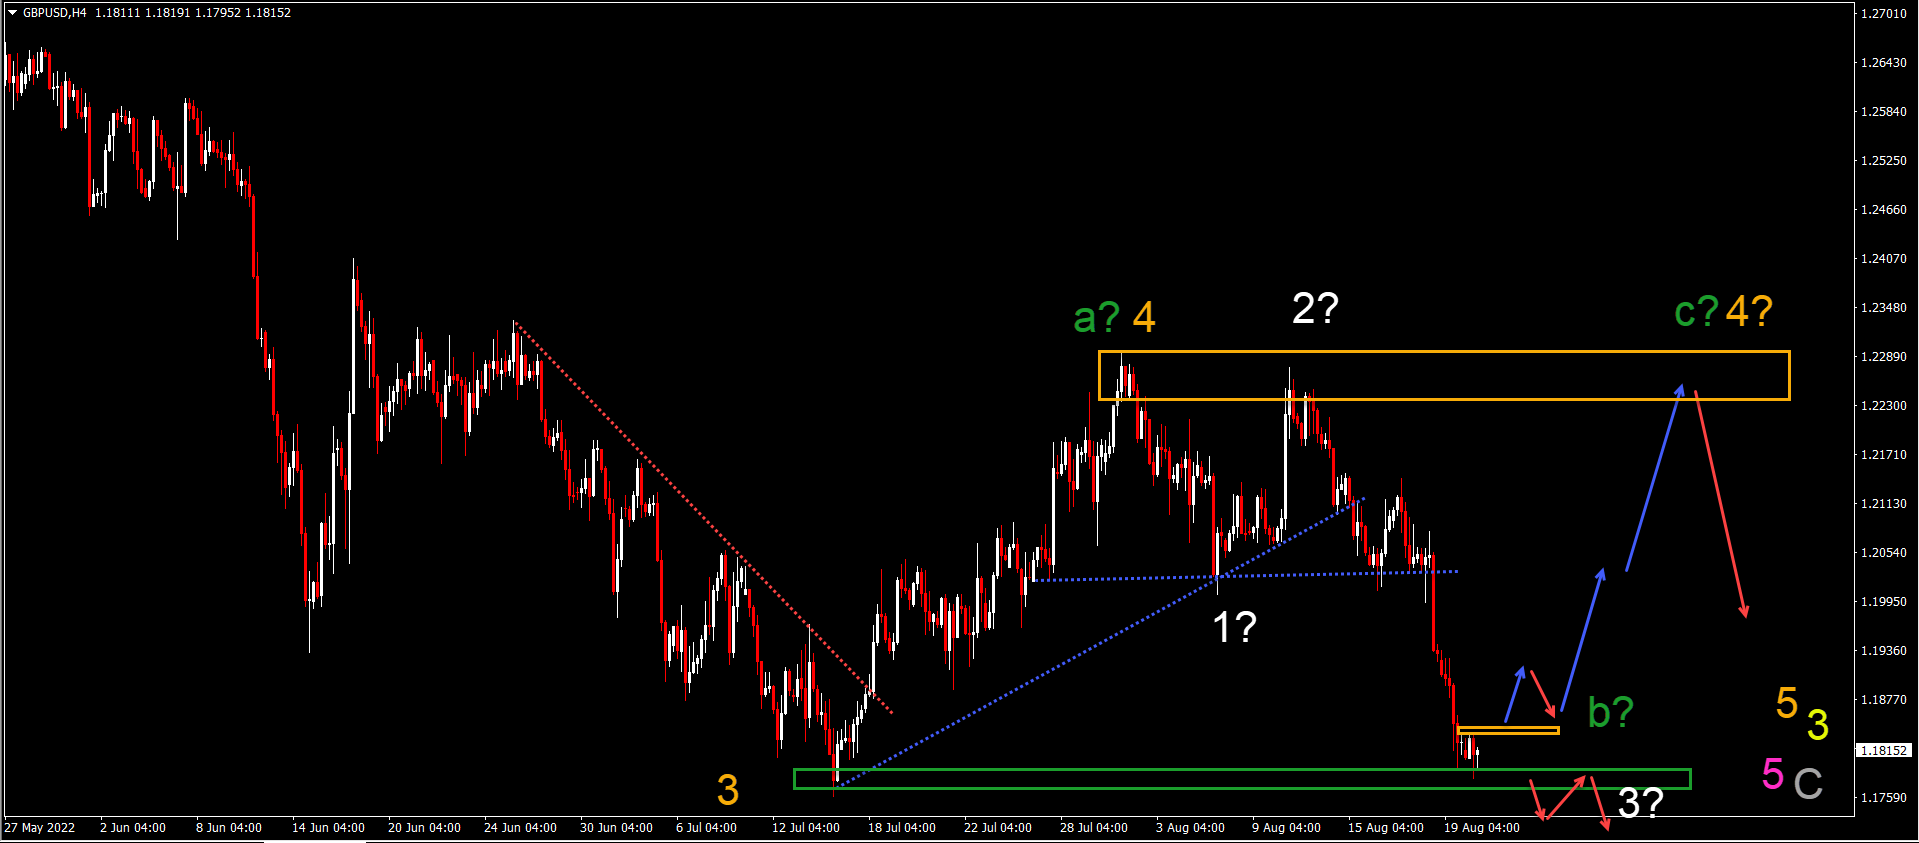
GBP/USD Testing Critical Bottom and Support
The GBP/USD is testing the previous bottom:
- The GBP/USD is testing a key support zone (green box).
- A bullish breakout above the resistance zone (orange) could indicate a rally (blue arrows) towards the previous top (orange box).
- In that case, price action is probably building an ABC (green) pattern in wave 4 (orange).
- A bearish breakout (red arrows) below the support (green box) could indicate an immediate downtrend towards 1.16 and 1.15.
- In that case, price action is probably building a wave 123 (white) impulse.
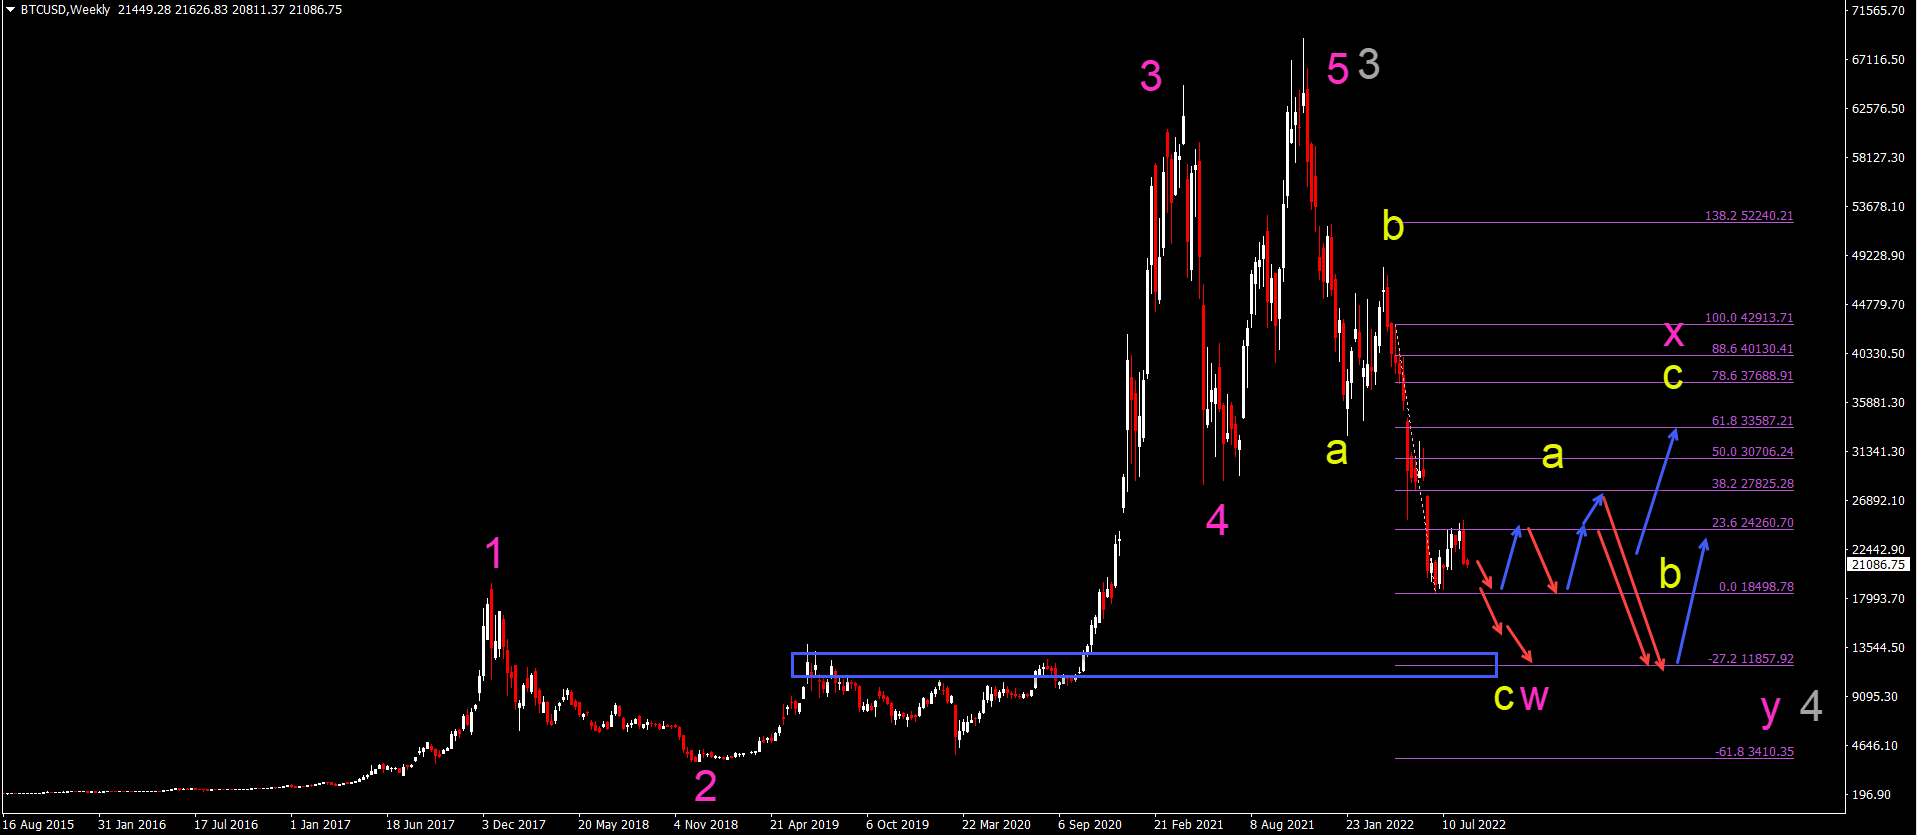
BTC/USD Wave Patterns Indicate Consolidation
Bitcoin (BTC/USD) is building a bullish retracement but price action is struggling to find any substantial move up:
- BTC/USD bearish breakout below the previous bottom (red arrows) indicates a downtrend continuation towards targets at $15k and $12.5k.
- A bullish bounce at or above the previous bottom could indicate a sideways movement.
- Price action could retrace upwards as high as the 38.2% Fibonacci retracement level but ultimately remain in a downtrend.
- Eventually one more lower low is possible to complete a wave C (yellow) or finish a wave Y (pink).
- A break above the 38.2% Fibonacci retracement level indicates a larger ABC (yellow) within wave Y (pink).
Good trading,
Chris Svorcik


Leave a Reply