Weekly Waves 21 Mar: EUR/USD, Bitcoin and DAX 30
March 21, 2022
4 min read
Subscribe
Hi Traders,
our weekly Elliott Wave analysis reviews the EUR/USD, the Bitcoin crypto currency, and the DAX 30 stock market chart.
EUR/USD Bullish Reversal Candlesticks on Weekly?
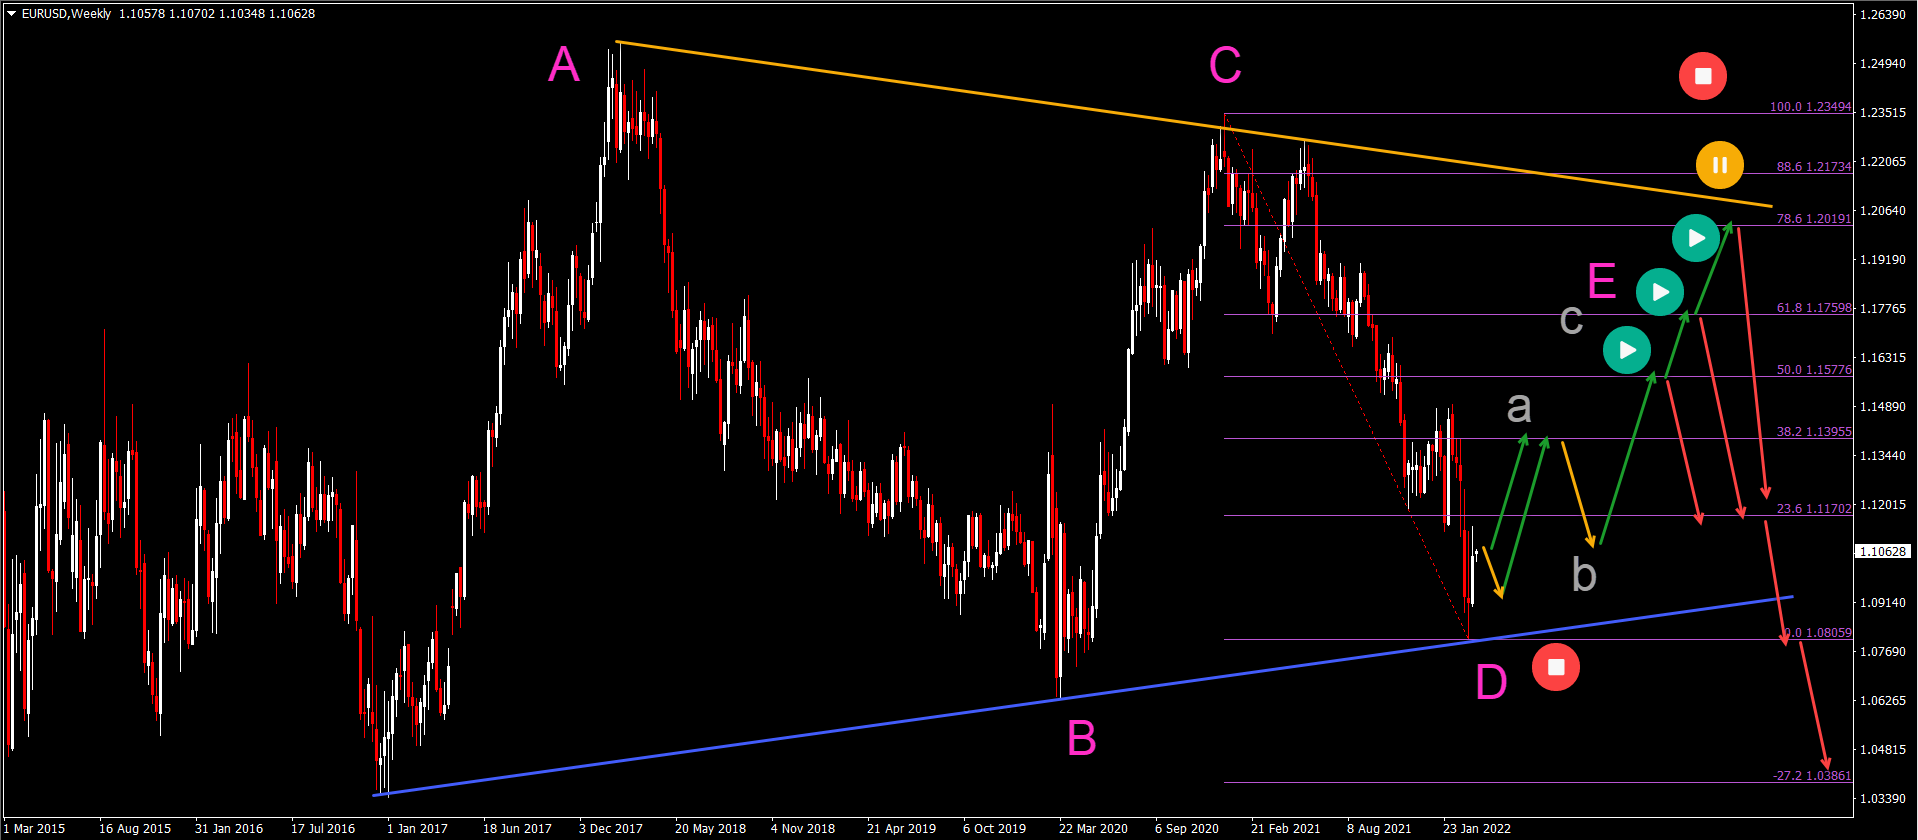
The EUR/USD showed a bullish weekly candle last week. What does it mean for the long-term picture? Let’s review:
- The EUR/USD was unable to break below the previous low and bottom. The bullish bounce created a bullish candlestick pattern on the weekly chart.
- The bullish reaction could indicate a first signal that a wave D (pink) of a larger ABCDE triangle pattern (pink) is taking place.
- A bullish ABC (green) pattern in wave E (pink) would confirm it.
- The wave A (green) will probably reach the 38.2% or 50% Fibonacci level before making a wave B (green) down.
- The wave E (pink) can bounce (red arrows) at any Fibonacci level of the wave C-D price swing.
- An immediate break below the bottom invalidates the bullish correction. Whereas a break above the top invalidates the bearish triangle pattern.
ATHENA EA
#H1
#H4
#Time frames
Award Winning Momentum TradingPromo
Yearly Target:
220%
Risk/Reward:
0.36
Platforms:
MT4
Historical Drawdown:
30%
Min. Deposit:
50$
Asset Types:
Forex

Presented by
Chris Svorcik
Verified on:
BTC/USD Bullish Triangle Chart Pattern
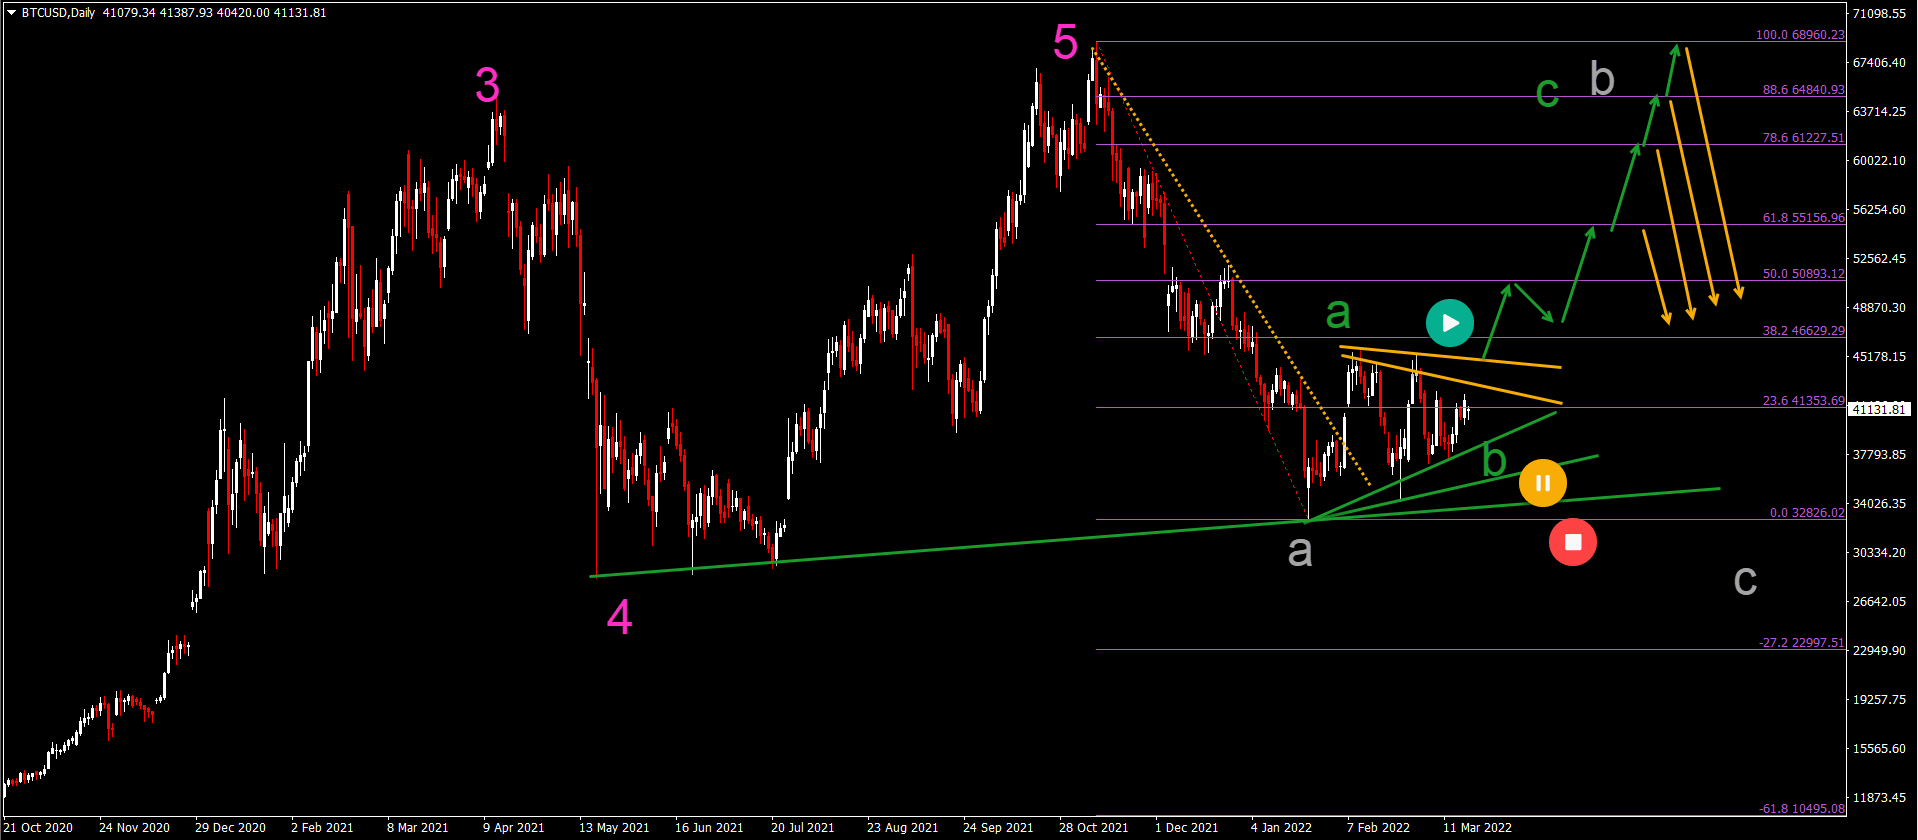
Bitcoin is building a triangle chart pattern at the moment, which is indicating a lengthy period of consolidation and uncertainty:
- BTC/USD is making lower highs and higher lows. This triangle pattern occurs after a strong bearish price swing (wave A gray). The triangle pattern, however, seems to favor a bullish retracement within wave B (gray).
- This bullish outlook remains valid as long as price action remains above the support trend lines (green).
- A break above the resistance (orange lines) could indicate a push up towards the Fibonacci resistance retracement levels and previous top.
- Those Fib levels and top are expected to be resistance and stop price from rising further.
- A deep price swing towards the Fibonacci levels could be an ABC flat whereas a shallow move up is an ABC zigzag.
- An immediate push below the support indicates a downtrend and not a bullish retracement.
DAX 30 Bounce Could Test Previous Top
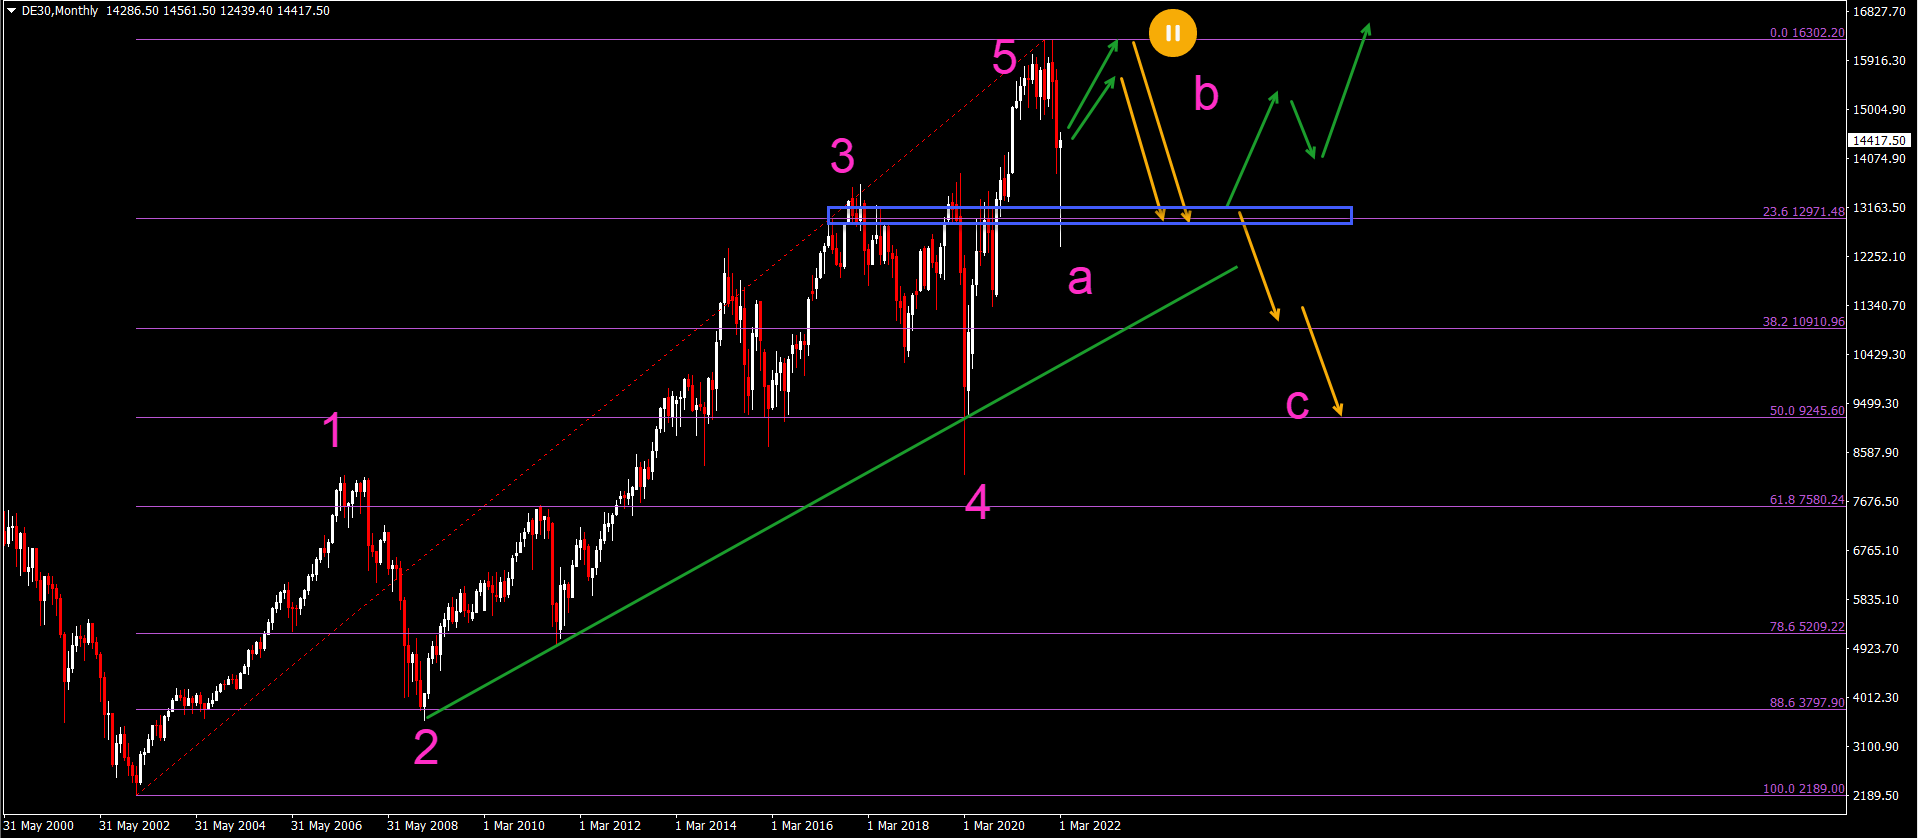
The DAX 30 chart made a strong decline but also a strong bounce after reaching the 12,500 support zone:
- The DAX 30 is probably making a wave B (pink) upwards.
- The resistance zone and previous top could therefore cap the move up.
- A bearish bounce at the resistance would confirm this wave analysis.
- A move down towards the 23.6% would then be expected.
- The next major support and decision zone is the 23.6% Fibonacci level.
- A break below the 23.6% Fib could indicate a deep wave C (pink).
- A bullish bounce could indicate a shallow ABC and more uptrend.
Good trading,
Chris Svorcik


Leave a Reply