Weekly Waves 17 October: EUR/USD, Bitcoin and Gas
October 17, 2022
4 min read

Hi Traders,
Our weekly Elliott Wave analysis reviews the EUR/USD 4 hour chart, the Natural Gas 4 hour chart, and the Bitcoin daily chart.
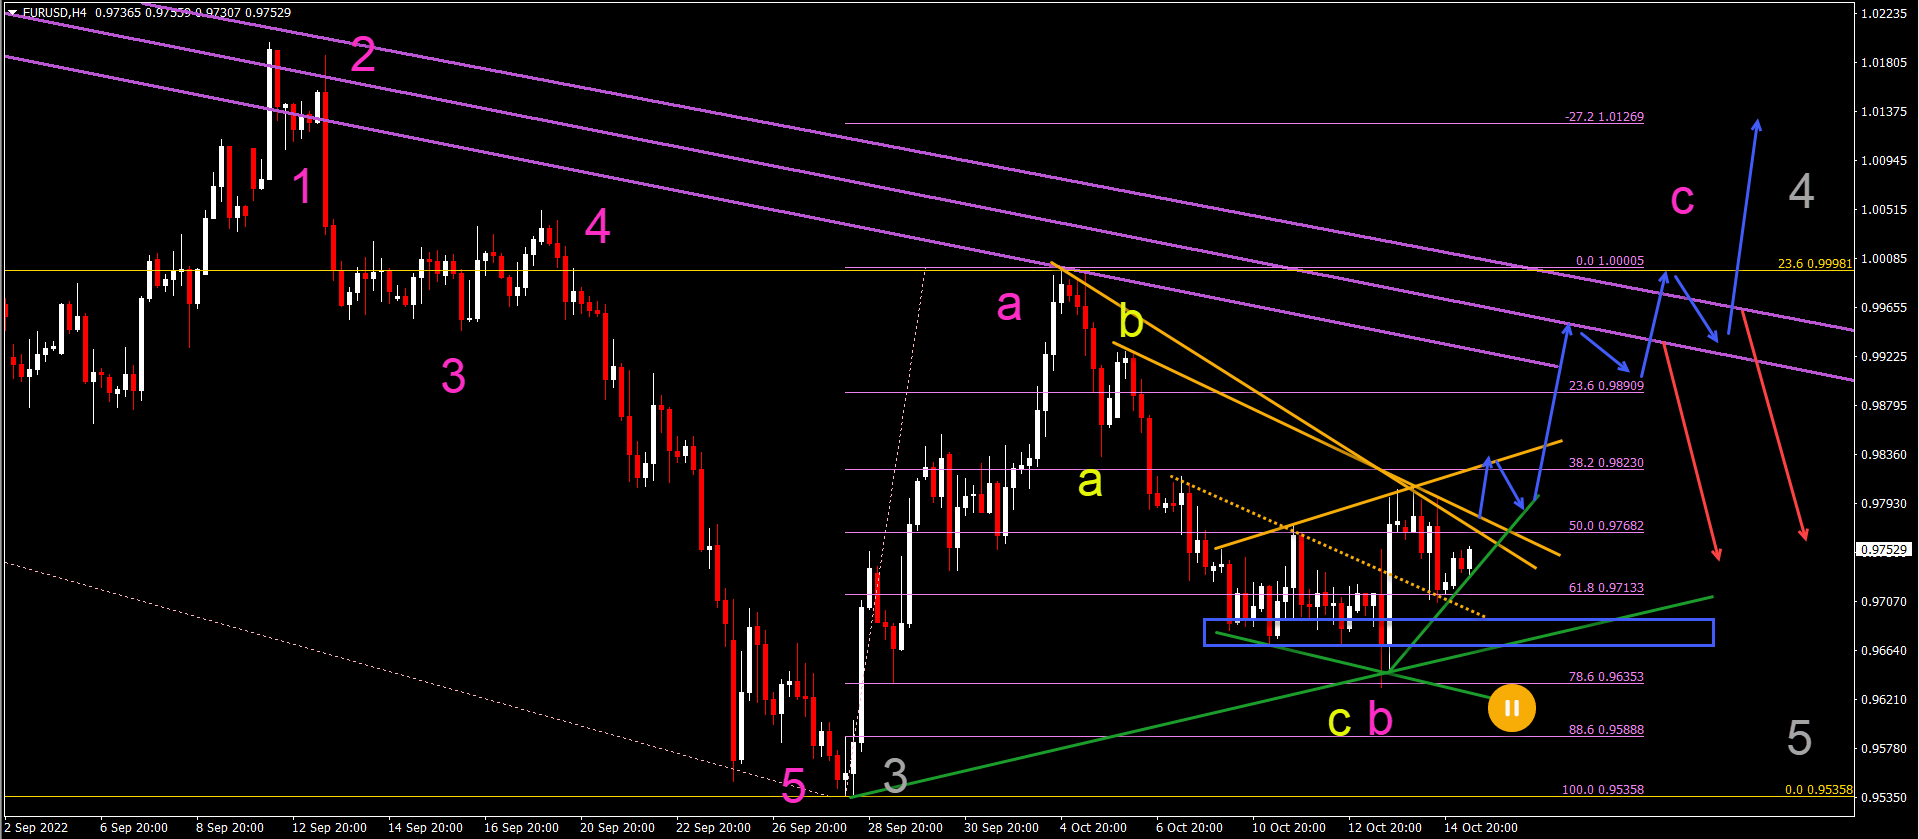
EUR/USD Bullish Bounce at the 78.6% Fib Support
The EUR/USD made a bullish bounce at the 78.6% Fibonacci retracement level:
- The EUR/USD seems to have completed an ABC (yellow) within a wave B (pink).
- There was a strong bullish bounce at the 78.6% Fibonacci support which confirms the end of the wave B (pink) and the start of the wave C (pink).
- Price action needs to now break above the resistance (orange) lines to confirm the continuation within the wave C (pink).
- The ABC (pink) is expected to complete a wave 4 (gray).
- A break below the 78.6% Fibonacci level indicates either a downtrend or complex correction within the wave B (pink).
ATHENA EA
#H1
#H4
#Time frames
Award Winning Momentum TradingPromo
Yearly Target:
220%
Risk/Reward:
0.36
Platforms:
MT4
Historical Drawdown:
30%
Min. Deposit:
50$
Asset Types:
Forex

Presented by
Chris Svorcik
Verified on:
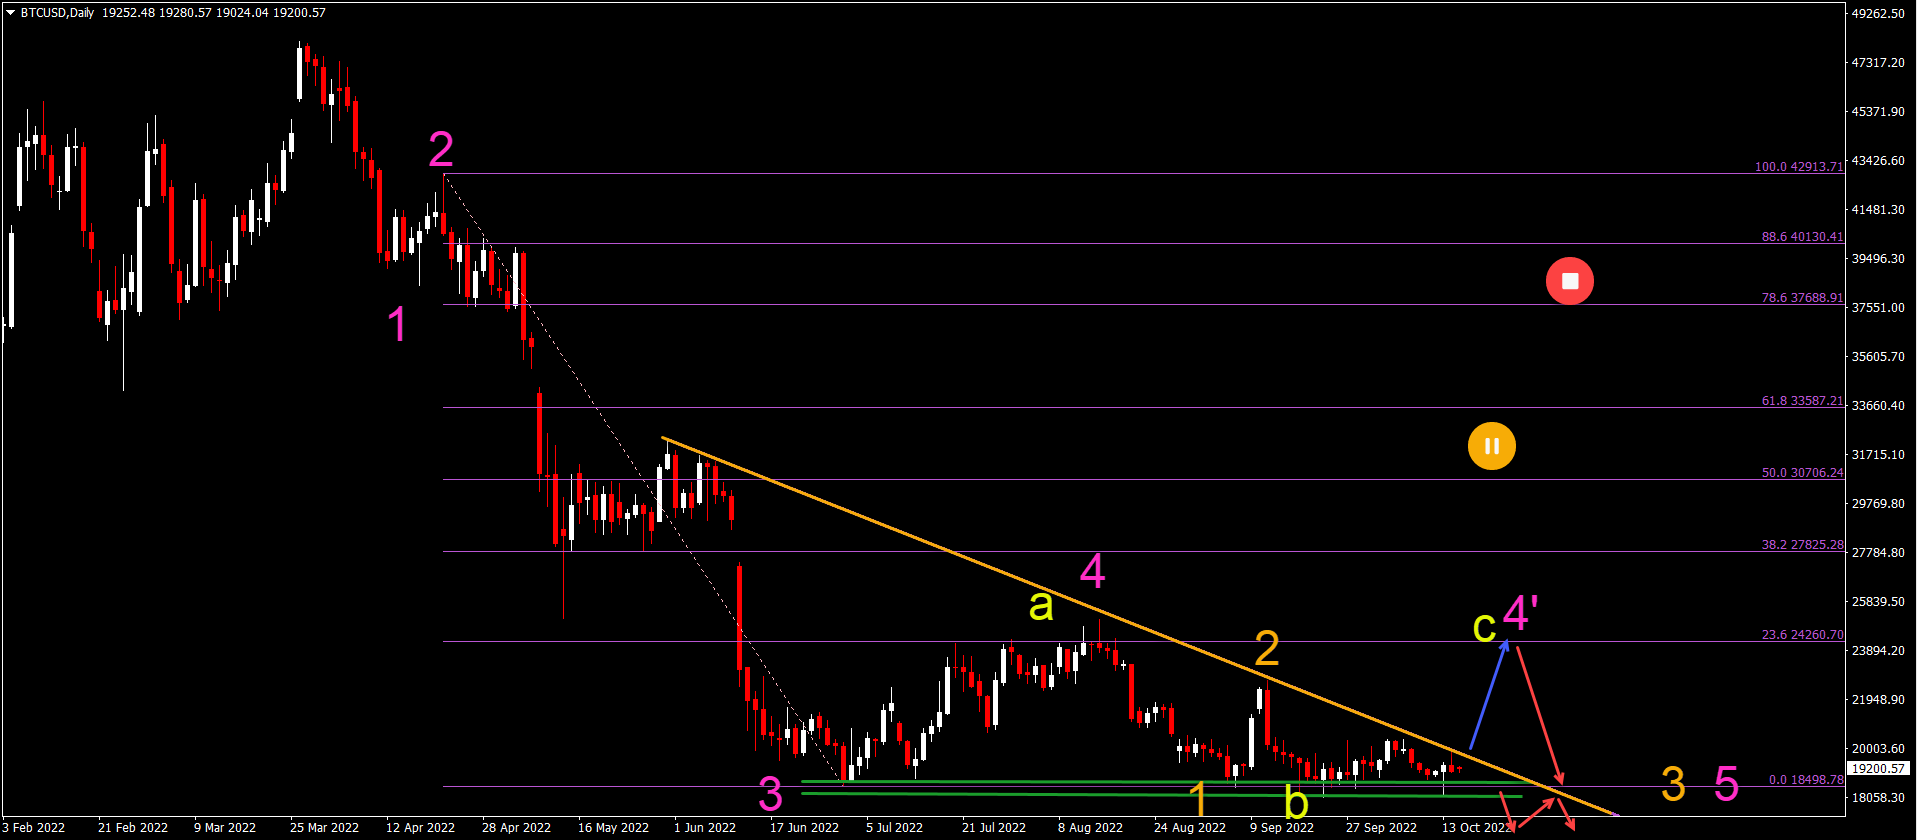
Bitcoin Builds Descending Wedge Pattern
Bitcoin (BTC/USD) is building a descending wedge chart pattern, which usually breaks bearishly:
- The BTC/USD has been testing the support zone (green) multiple times.
- So far, BTC/USD was unable to break below the support levels.
- But price action was hardly able to move up because it faced strong resistance with every bullish attempt.
- The flat bottom but descending resistance line indicates a descending wedge pattern.
- A bullish breakout (blue arrow) could indicate an ABC (yellow) within the wave 4’ (pink).
- A bearish breakout (red arrows) indicates an immediate downtrend within the wave 3 (orange) of wave 5 (pink).
- The bearish targets are at $15k, and $12.5k.
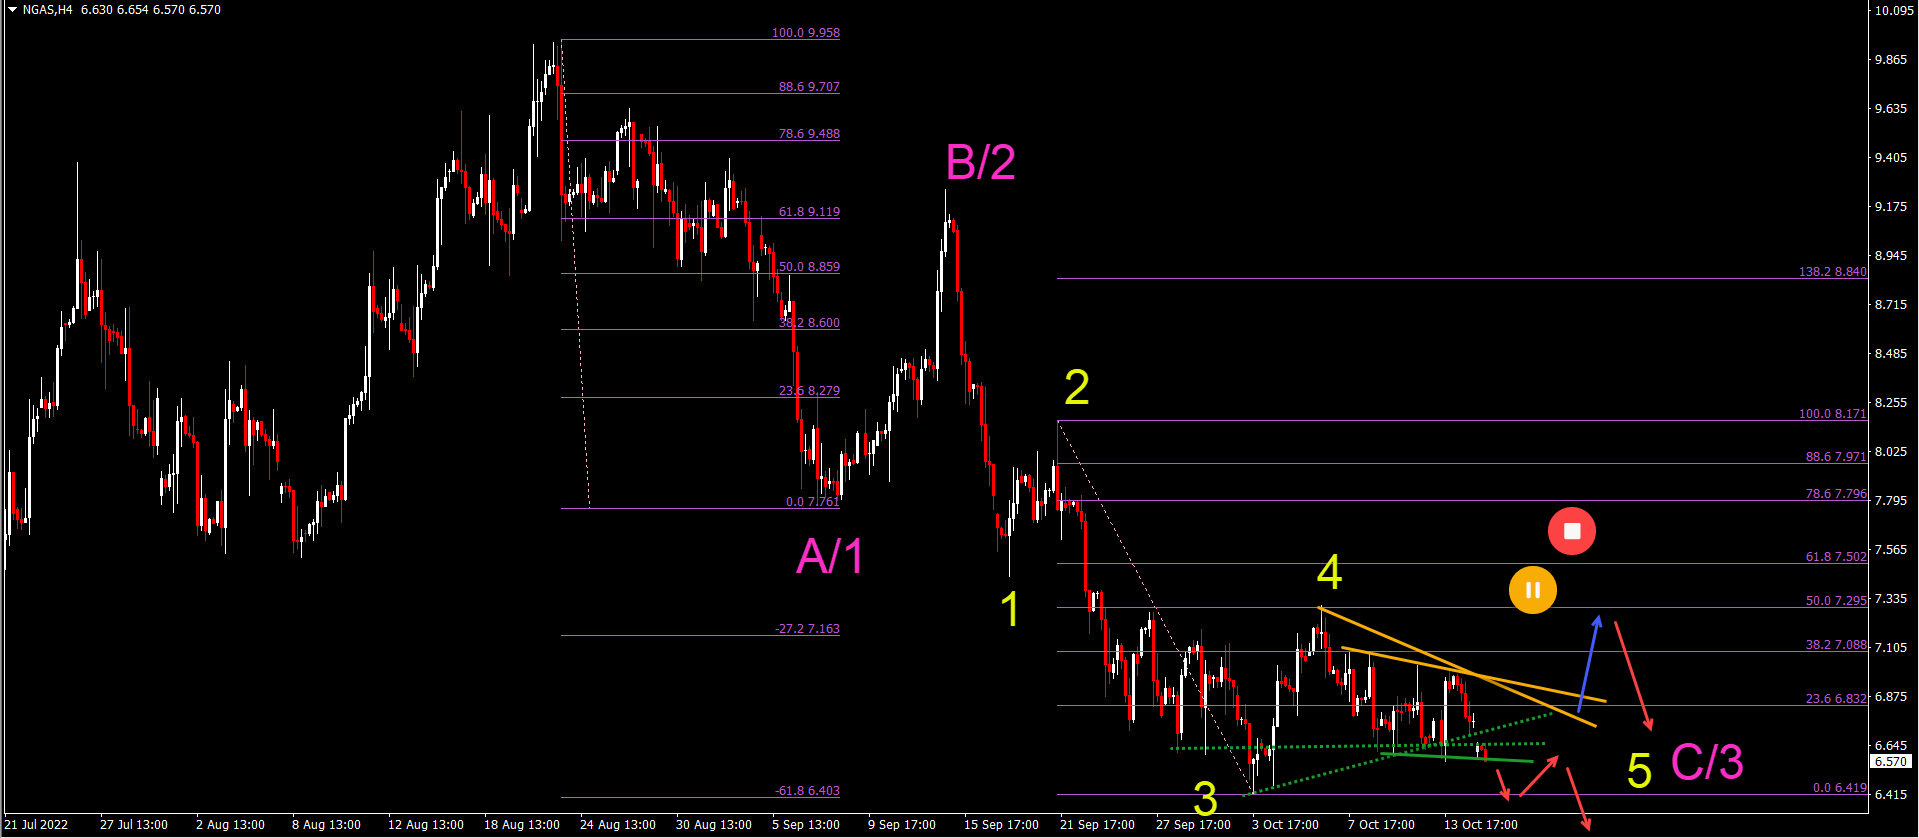
NGAS Bearish Bounce at 50% Fib Resistance
NGAS made a bearish bounce at the 50% Fibonacci level, which is probably a wave 4 (yellow):
- The bearish bounce could indicate a 5 wave (yellow) pattern within a wave C or wave 3 (pink).
- A bearish breakout (red arrows) could occur below the last remaining support line (green).
- The main targets are $6, $5.50, $5.30 and $5.
- A break below the $5 increases the chance that price action is in a bearish wave 3 (pink) rather than a wave C (pink).
- A bullish breakout (blue arrow) above the resistance (orange) could indicate an expanded wave 4.
- A break above the 50% Fib places the bearish Elliott Wave analysis on hold.
Good trading,
Chris Svorcik


Leave a Reply