Weekly Waves 15 August: EUR/USD, US30 and Bitcoin
August 15, 2022
5 min read

Hi Traders,
Our weekly Elliott Wave analysis reviews the EUR/USD 4 hour chart, the US30 (DJI) weekly chart, and the Bitcoin crypto currency 4 hour chart.
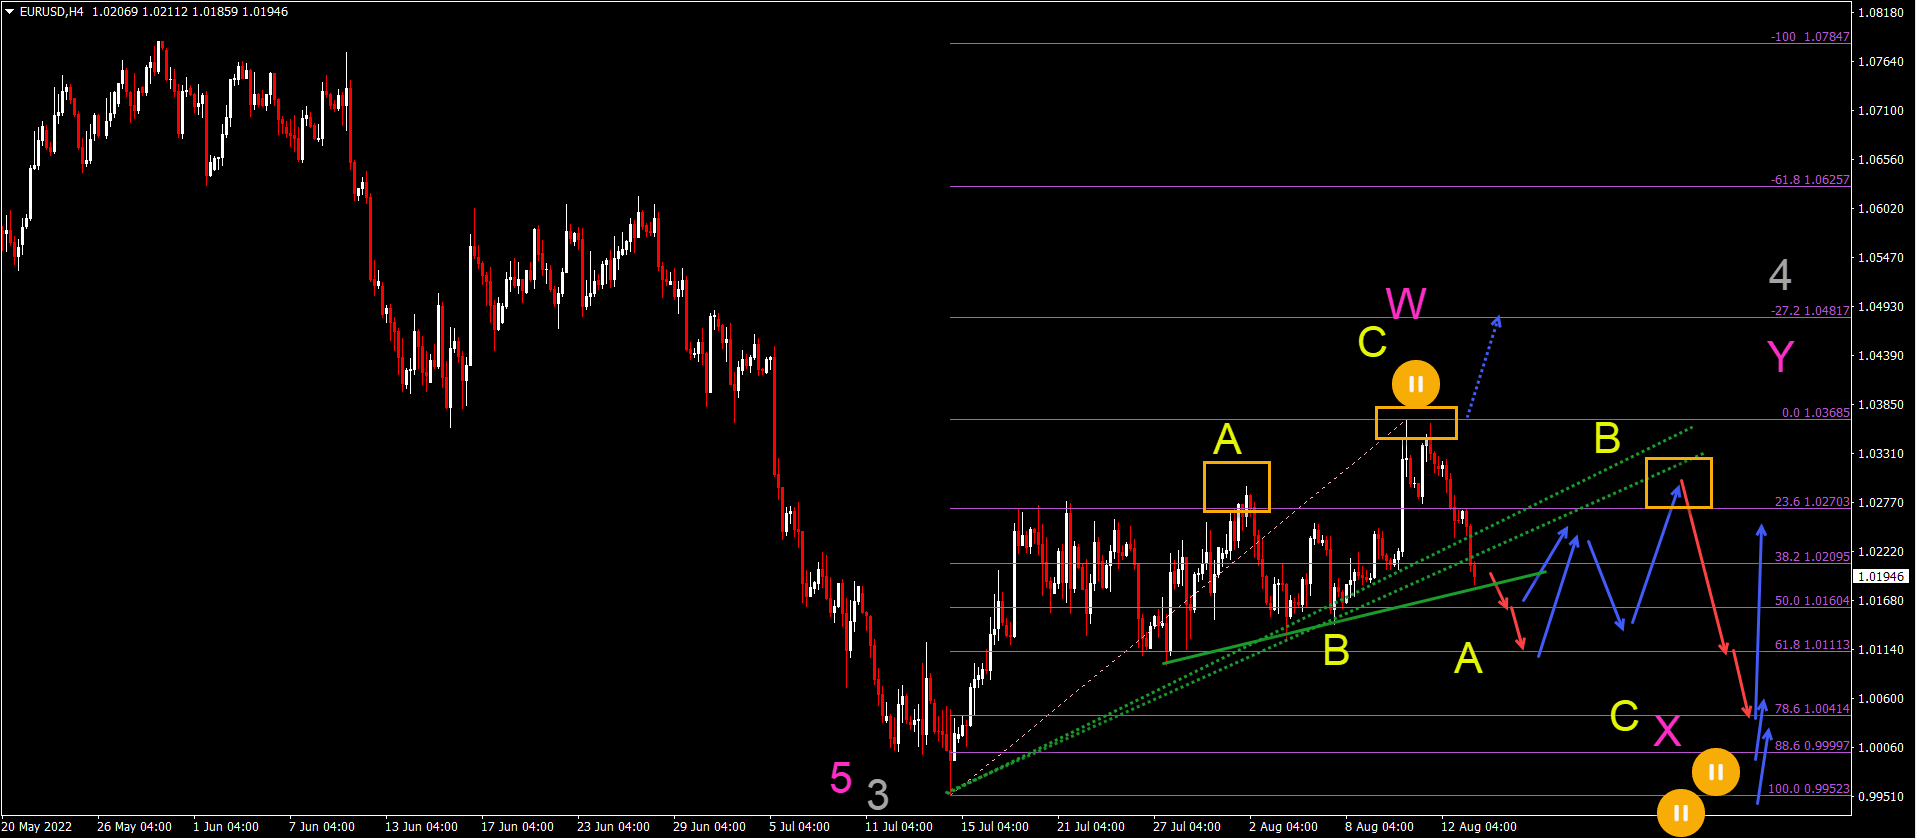
EUR/USD Bearish ABC in Larger Bullish Correction
The EUR/USD is showing a strong bearish decline at the moment. Let’s review the Elliott Wave patterns to understand why price action made such a strong reversal:
- The EUR/USD bullish price action was labeled as a bullish correction so the choppy and weak uptrend is what we expected.
- The bullish price action seems to have completed an ABC (yellow) pattern.
- The bullish correction, however, could still be alive because we believe that a larger WXY (pink) is taking place in wave 4 (gray).
- Non-technical reasons to expect a longer correction include the fact that August is usually a choppy month, the slight pause in inflation (from month to month perspective), and decrease of the year on year inflation rate last month.
- Therefore we now expect a wave X (pink). To confirm this Elliott Wave pattern, we should see an ABC (yellow) wave within wave X (pink).
- A bullish bounce could take place at the 50% or 61.8% Fibonacci retracement level.
- The bullish bounce could take price up to the head and shoulders level (orange boxes).
- A bearish bounce at the resistance could see price decline to challenge the deeper Fibonacci support levels and most likely, we should see a bullish reversal at those support zones.
ATHENA EA
#H1
#H4
#Time frames
Award Winning Momentum TradingPromo
Yearly Target:
220%
Risk/Reward:
0.36
Platforms:
MT4
Historical Drawdown:
30%
Min. Deposit:
50$
Asset Types:
Forex

Presented by
Chris Svorcik
Verified on:
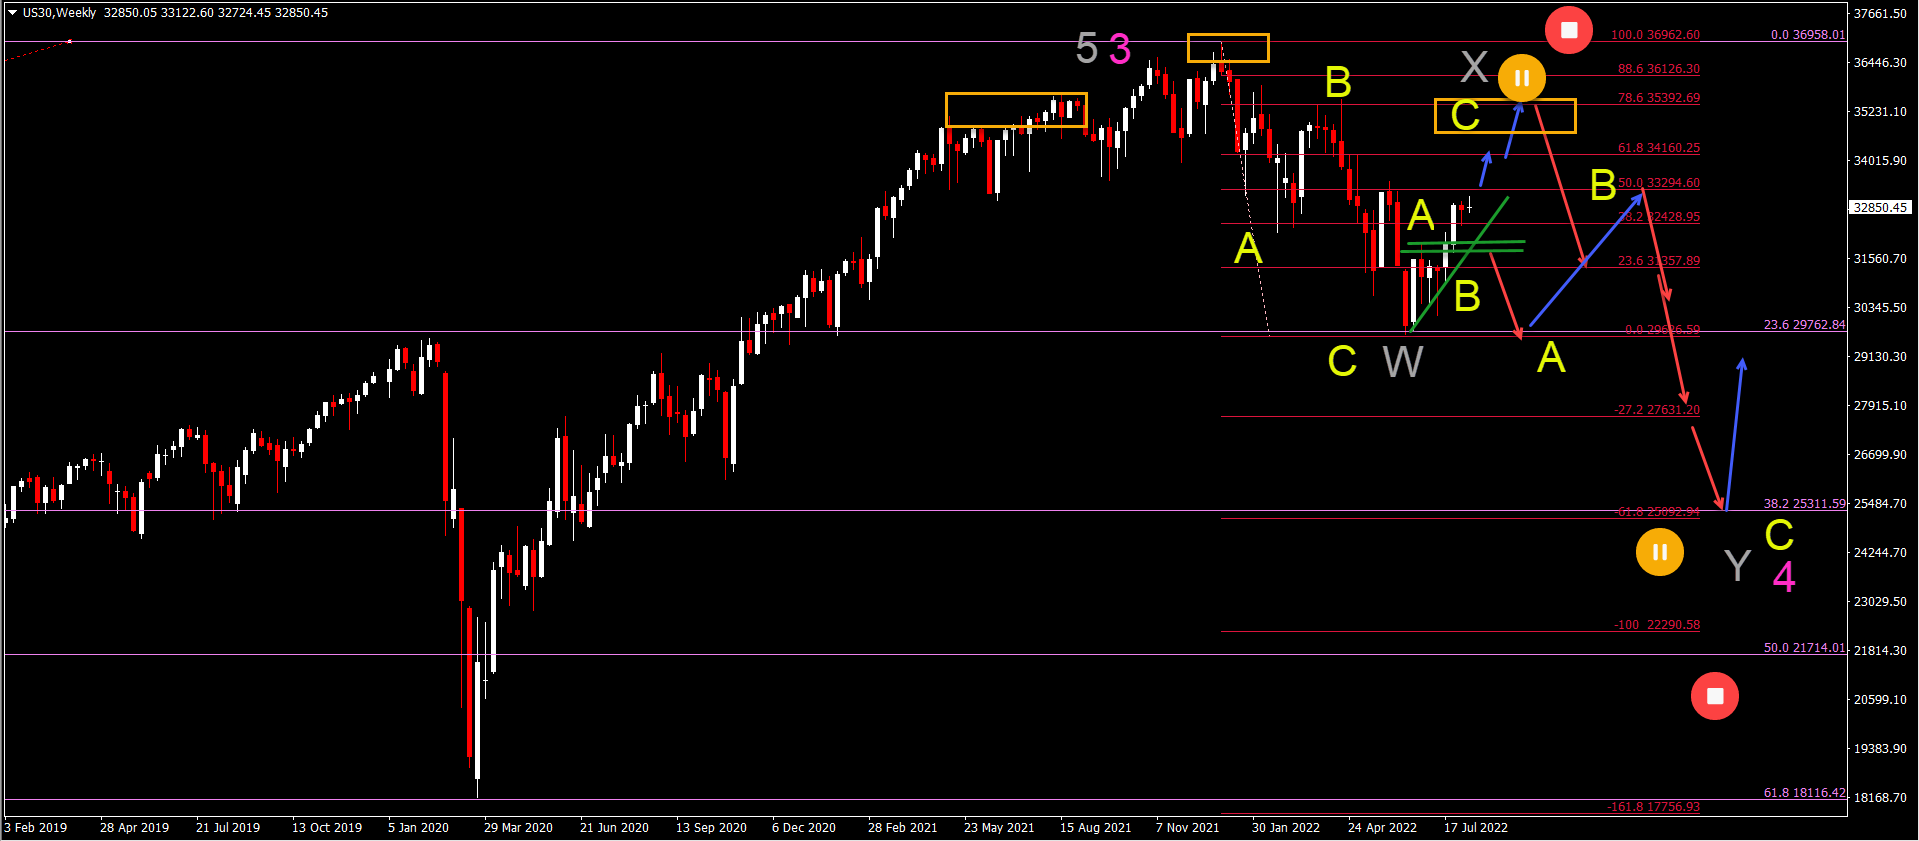
US30 Rally Expected to Reverse at Resistance
The US30 weekly chart is showing bullish price action but the rally looks like a rise before yet another decline:
- The US30 chart could have some space for a small rally.
- Although price action has reached the 50% Fibonacci level, price action could rise as high as the head and shoulders level (orange boxes).
- A bearish bounce is expected at this resistance zone. A break above it would probably change the bearish perspective.
- A bearish breakout (red arrows) below the support (green lines) could indicate that the rally is finished.
- A larger bullish ABC (yellow) pattern should complete wave X (gray).
- A bearish ABC (yellow) should then take price action down to the 38.2% Fibonacci retracement level of a larger wave 4 (gray).
- A larger complex correction could emerge so that wave Y (gray) completes a larger wave X of the wave 4.
- Eventually, once the bearish correction completes waves 4 (pink), a new uptrend could emerge in wave 5 as long as price action remains above the 50%.
- A break below the 38.2% and especially the 50% Fibonacci retracement level indicates a strong downtrend.
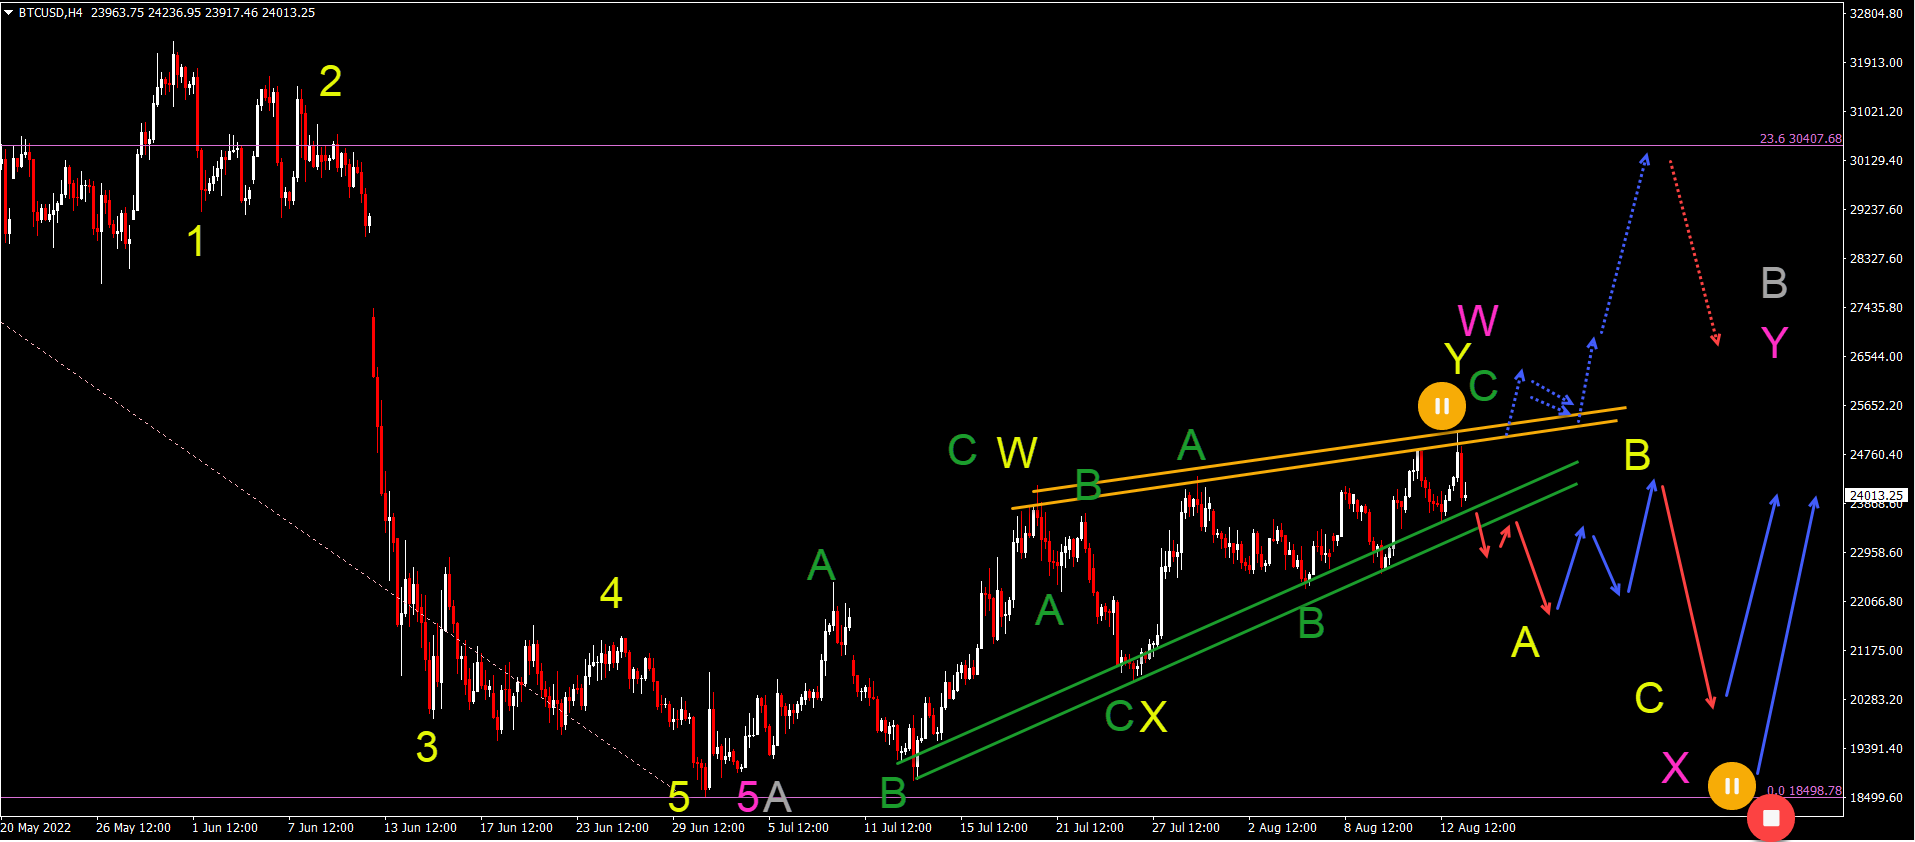
BTC/USD Should Rally after ABC Down
Bitcoin (BTC/USD) is building a rising wedge reversal pattern:
- BTC/USD rising wedge is indicating the end of the bullish rally, unless price action manages to break above the resistance trend lines (orange).
- A bullish breakout would in that case start a potential rally (dotted blue arrows) towards 23.6% Fibonacci retracement level.
- A breakout below the support lines (green) could start a bearish correction lower (red arrows).
- A larger ABC (green) pattern has probably completed wave Y (yellow) of wave W (pink).
- Now an ABC (yellow) is expected to unfold in wave X (pink).
- Once the wave X (pink) is completed, a new bullish rally should take price up again within wave Y (pink) of wave B (gray).
Good trading,
Chris Svorcik


Leave a Reply