Weekly Waves 14 November: EUR/USD, Bitcoin and Gold
November 14, 2022
4 min read
Hi Traders,
Our weekly Elliott Wave analysis reviews the EUR/USD daily chart, the XAU/USD 1 hour chart and the Bitcoin weekly chart.
EUR/USD Bullish 400 Pips Price Rally
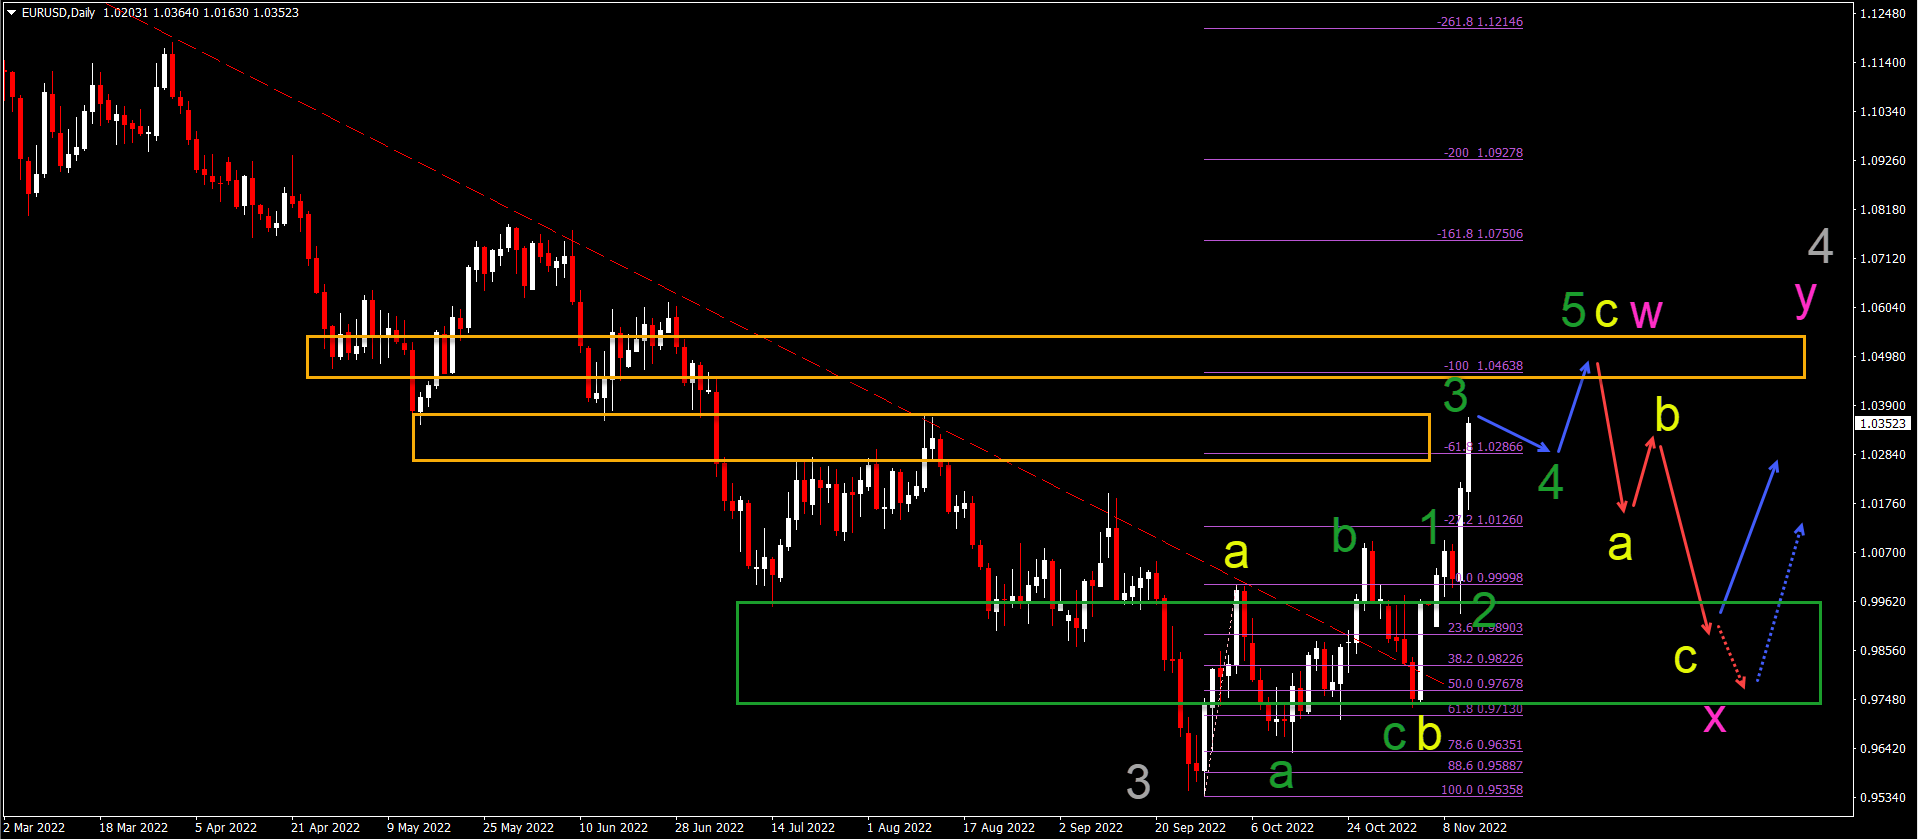
The EUR/USD made a very strong bullish swing last week. Price made a bullish bounce at 0.9950 and rallied 400 pips to reach 1.0350:
- The EUR/USD rally started after price action completed a bearish ABC (yellow) pattern in wave B (green).
- The EUR/USD tested and bounced at the 61.8% Fibonacci retracement support level.
- A larger ABC (yellow) zigzag seems to be unfolding within a complex WXY (pink) correction of wave 4 (gray).
- Within the wave C (yellow), price action is moving in a 5 wave pattern (green).
- We expect wave 3 (green) to finish soon, which is then followed by wave 4 (green) and wave 5 (green).
- The main target is the -100% Fibonacci level near 1.0450 and 1.05.
- A bearish ABC (red arrow) should emerge at this target zone.
ATHENA EA
#H1
#H4
#Time frames
Award Winning Momentum TradingPromo
Yearly Target:
220%
Risk/Reward:
0.36
Platforms:
MT4
Historical Drawdown:
30%
Min. Deposit:
50$
Asset Types:
Forex

Presented by
Chris Svorcik
Verified on:
Bitcoin Bearish Drop Bounces at $15k
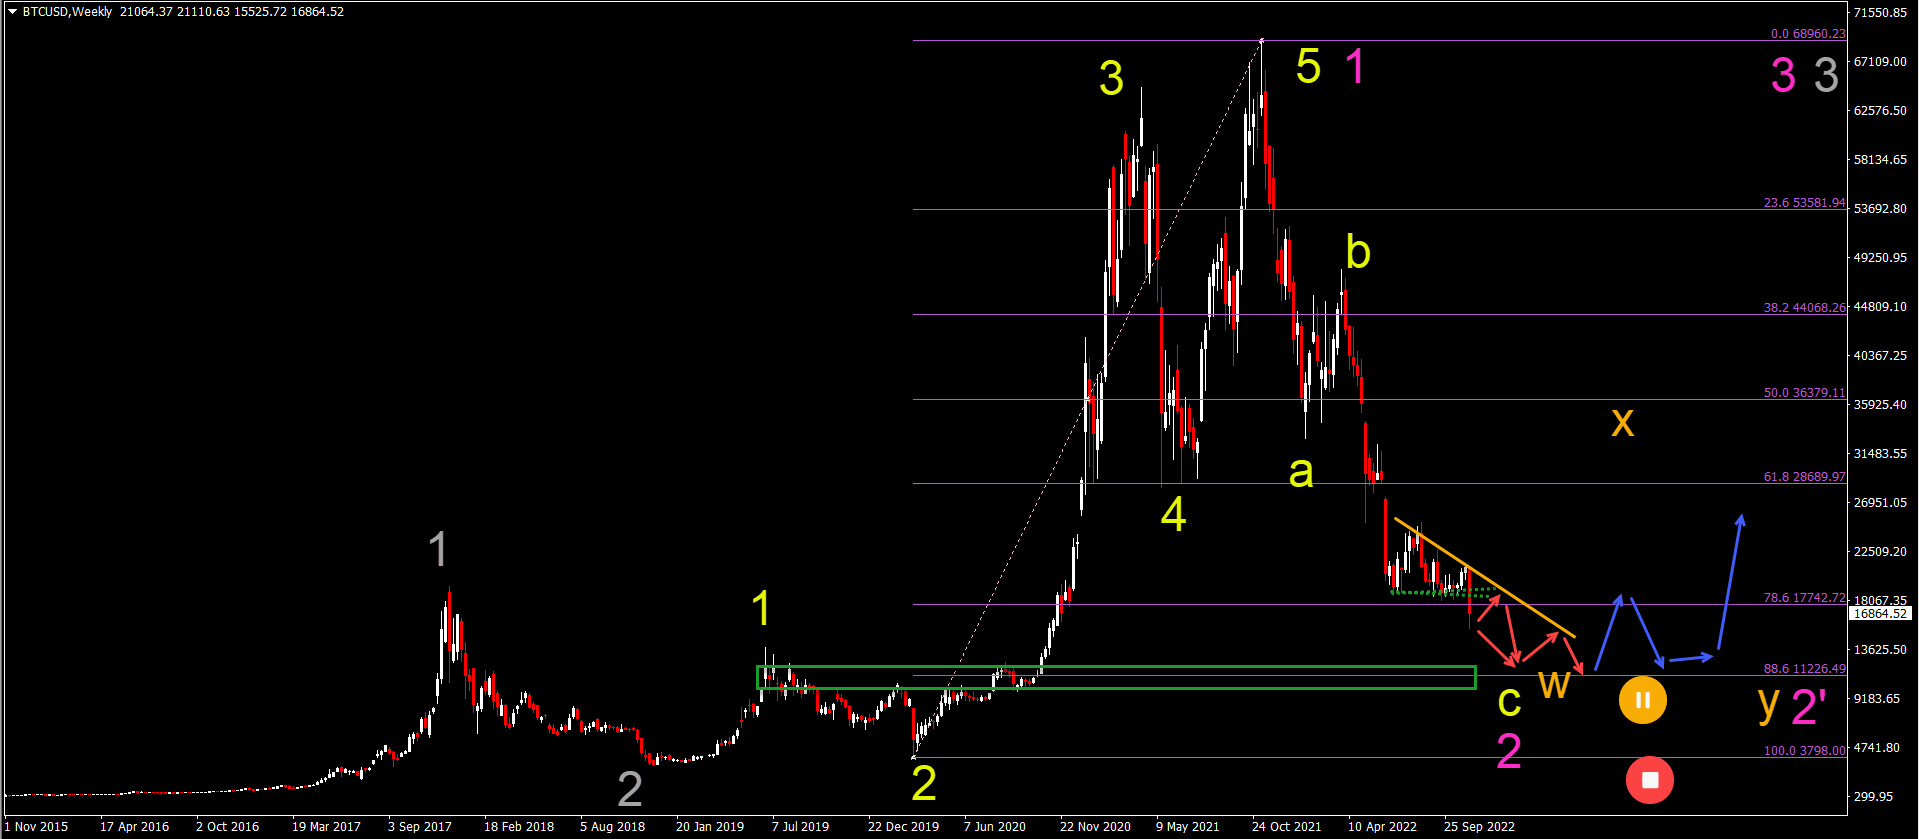
Bitcoin (BTC/USD) broke below the support trend lines (dotted green) after moving sideways at the 78.6% Fibonacci support level for a couple of months:
- The BTC/USD bearish breakout below the 78.6% Fibonacci level confirms a continuation of the bearish wave C (yellow).
- The target of the bearish wave C (yellow) is now at the 88.6% Fibonacci level at $11.2k. Other rounds levels like $15k and $12.5k will also act as support.
- Price action already made a bounce at the $15k level but a further decline is possible after the bullish correction is completed.
- A falling wedge pattern (red arrows) could develop as price action inches closer to the $11k mark.
- Price action could complete a wave C (yellow) of wave 2 (pink) or a wave C of wave W (orange) of a larger wave 2’ (pink).
- A bullish bounce (blue arrows) could emerge at the 88.6% Fibonacci level.
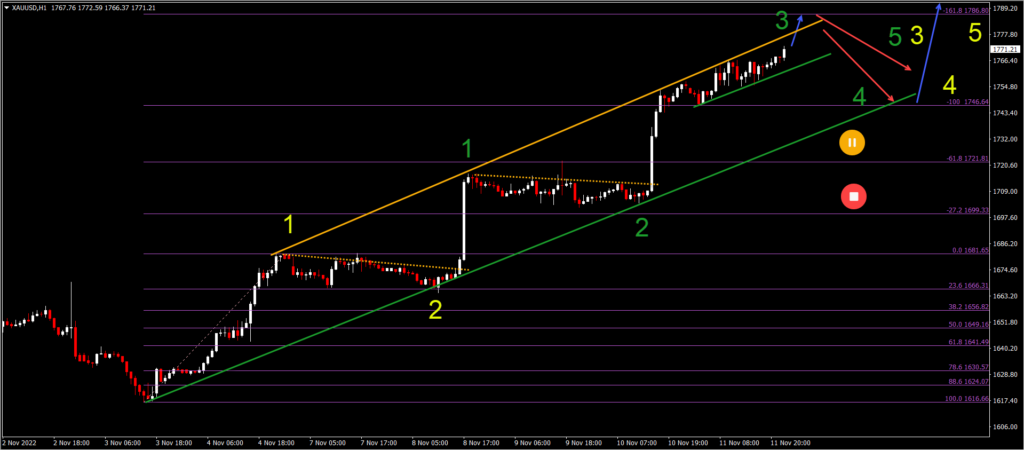
Gold Bull Flag Patterns Hint at More Upside
Gold (XAU/USD) is moving up higher within a bullish trend channel after creating a double bottom chart pattern on the 4 hour and daily charts:
- The Gold chart made several bullish breakouts above the resistance trend line (dotted orange).
- Gold seems to be developing an impulsive price swing with a 5 wave pattern (green) in wave 3 (yellow).
- Price action is expected to continue higher (blue arrow) towards the -161.8% Fibonacci target.
- Once the wave 3 (green) is completed, a bearish retracement (red arrows) is expected within wave 4 (green).
- The wave 4 (green) remains valid as long as price action remains in the bullish channel.
- A bullish bounce should take place within wave 5 (green) of wave 5 (yellow).
Good trading,
Chris Svorcik


Leave a Reply