Weekly Waves 12 September: EUR/USD, USD/JPY and Bitcoin
September 12, 2022
4 min read

Hi Traders,
Our weekly Elliott Wave analysis reviews the EUR/USD weekly chart, the USD/JPY 4 hour chart, and the Bitcoin crypto currency daily chart.
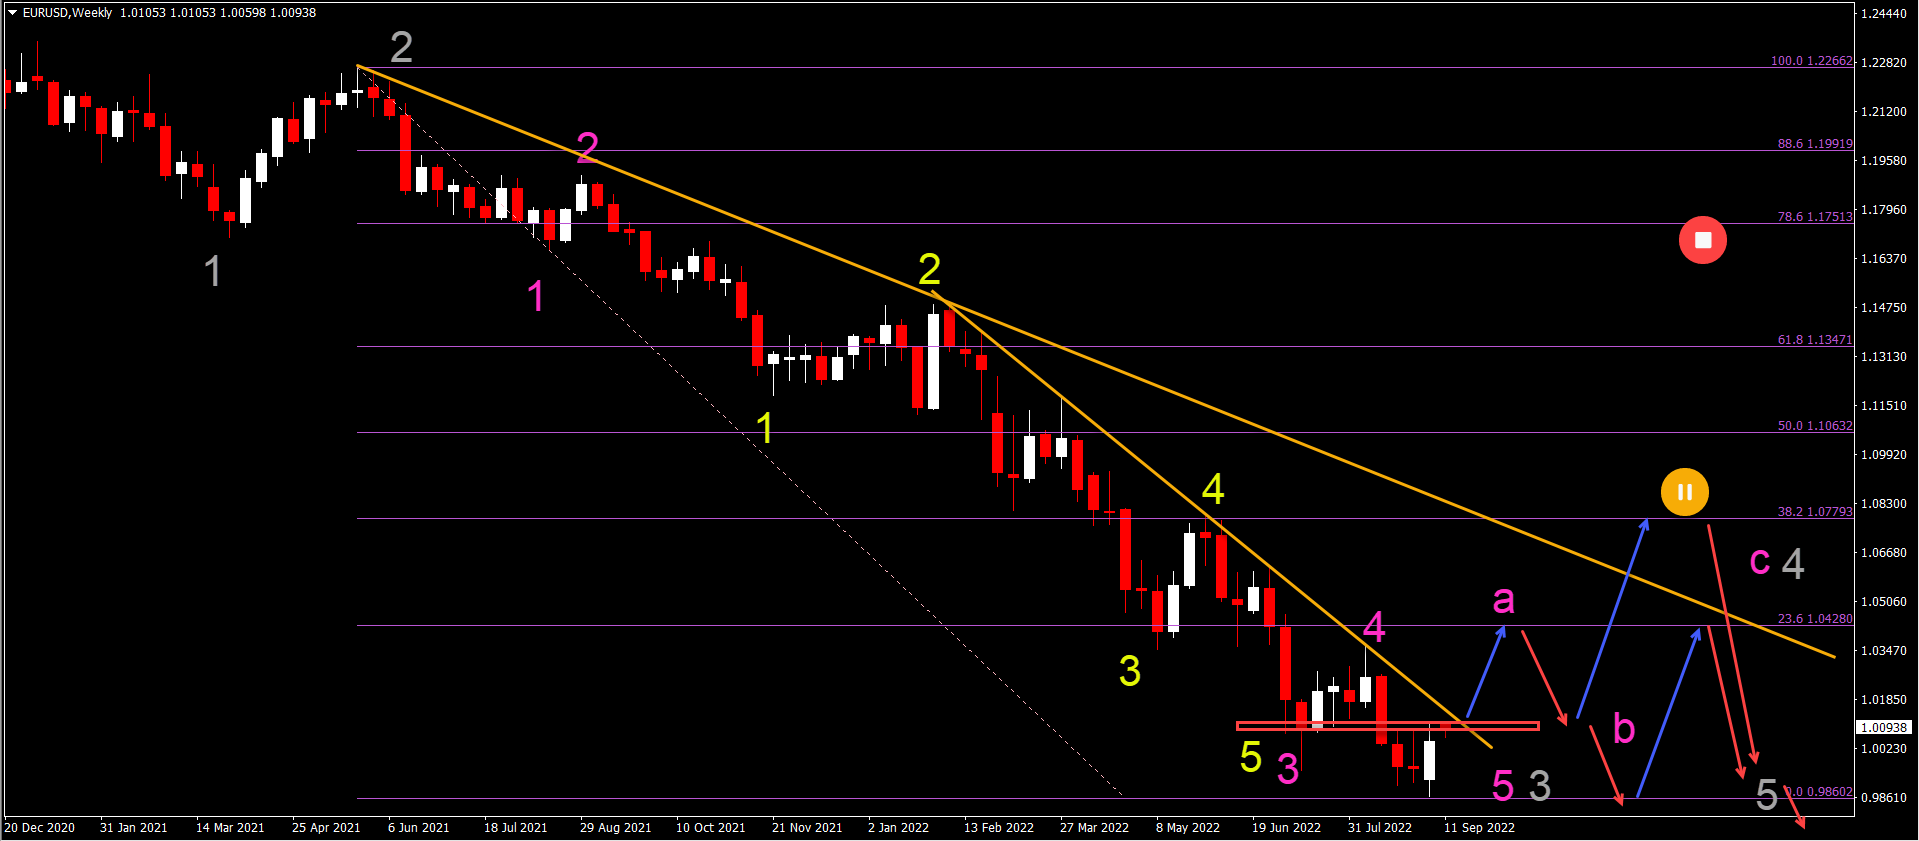
EUR/USD Bullish Reversal After Strong Weekly Candle
The EUR/USD is showing a strong bullish weekly candlestick, which is expected to start a bullish correction
- The EUR/USD is building a bearish wave 3 (gray) impulse.
- However, the bullish weekly candle is expected to signal the end of wave 3.
- The strong bullish weekly candle looks like a strong reversal candle with a lower low but also a higher high and a close near the high, indicating buying pressure as last week closed.
- A break above the resistance zone (red box) and last week’s high should start a bullish impulse higher.
- This could start a wave A (pink) within a larger ABC (pink) correction of wave 4 (gray).
- The 23.6% and 38.2% Fibonacci retracement levels are expected to act and hold as resistance. A break above the 38.2/50% Fib zones could indicate a different wave pattern.
ATHENA EA
#H1
#H4
#Time frames
Award Winning Momentum TradingPromo
Yearly Target:
220%
Risk/Reward:
0.36
Platforms:
MT4
Historical Drawdown:
30%
Min. Deposit:
50$
Asset Types:
Forex

Presented by
Chris Svorcik
Verified on:
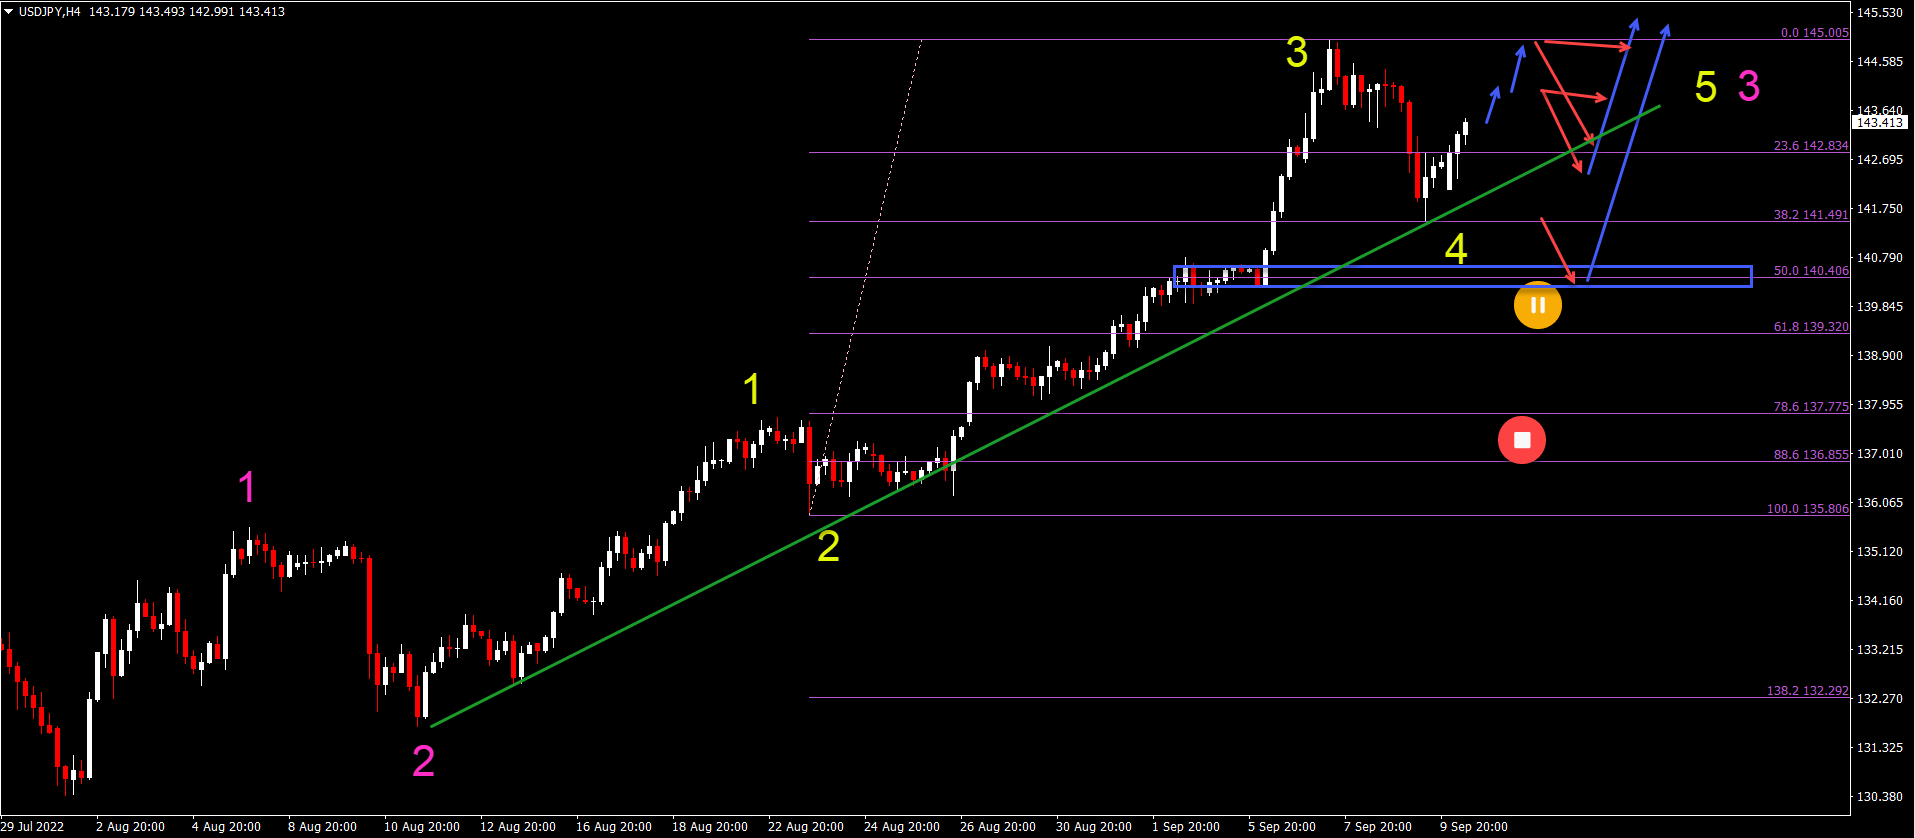
USD/JPY Bullish Bounce at 38.2% Fibonacci Level
The USD/JPY uptrend has been extremely strong since March 2022 with a price movement from 114 to 145 in a matter of months:
- The USD/JPY bullish impulse is very strong and is therefore expected to be a wave 3 (pink) of larger wave 3(s).
- Within the wave 3 (pink), there is an internal 5 wave pattern (yellow).
- This wave 4 (yellow) remains valid as long as price action respects the 38.2% and 50% Fibonacci retracement levels.
- The maximum retracement should be the support zone (blue box).
- A break below the support zone indicates a potentially different Elliott Wave pattern.
- The main bullish targets are 147.50 and 150.
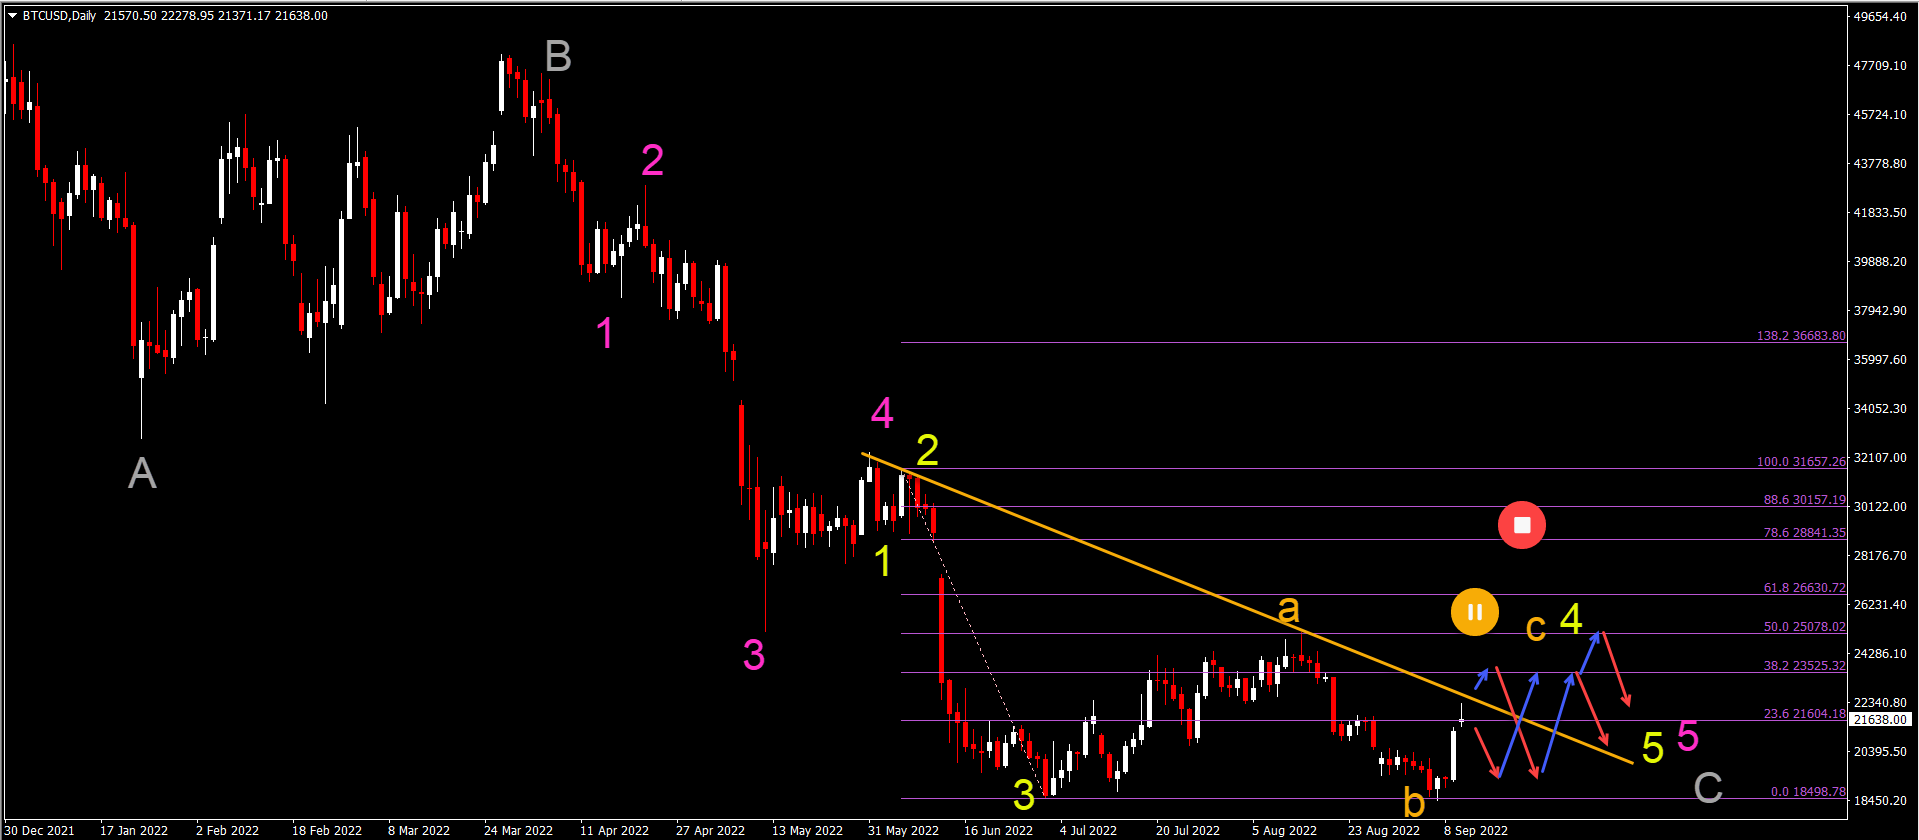
BTC/USD Bullish Retracement Faces Hefty Resistance Zones
Bitcoin (BTC/USD) made a strong bullish bounce at the previous bottom:
- The BTC/USD bullish rally at the previous bottom is in our analysis a wave B (orange) of a larger ABC (orange) in wave 4 (yellow).
- The wave 4 (yellow) of a larger wave 5 (pink) of wave C (gray) remains valid as long as price action respects the 38.2% and 50% Fibonacci resistance levels.
- A bearish continuation lower should aim at targets around $17.5k, $15k and perhaps as low as $10k.
- A break above the 50% Fibonacci level indicates that the wave B (orange) could have been wave 5 instead.
- This is certainly the case if price action breaks above 78.6% Fibonacci level, which means the end of the downtrend and wave C (gray).
Good trading,
Chris Svorcik


Leave a Reply