Weekly Waves 12 December: EUR/USD, GBP/USD and Gold
December 12, 2022
4 min read
Hi Traders,
Our weekly Elliott Wave analysis reviews the EUR/USD weekly chart, the GBP/USD 4 hour chart, and the Gold (XAU/USD) daily chart.
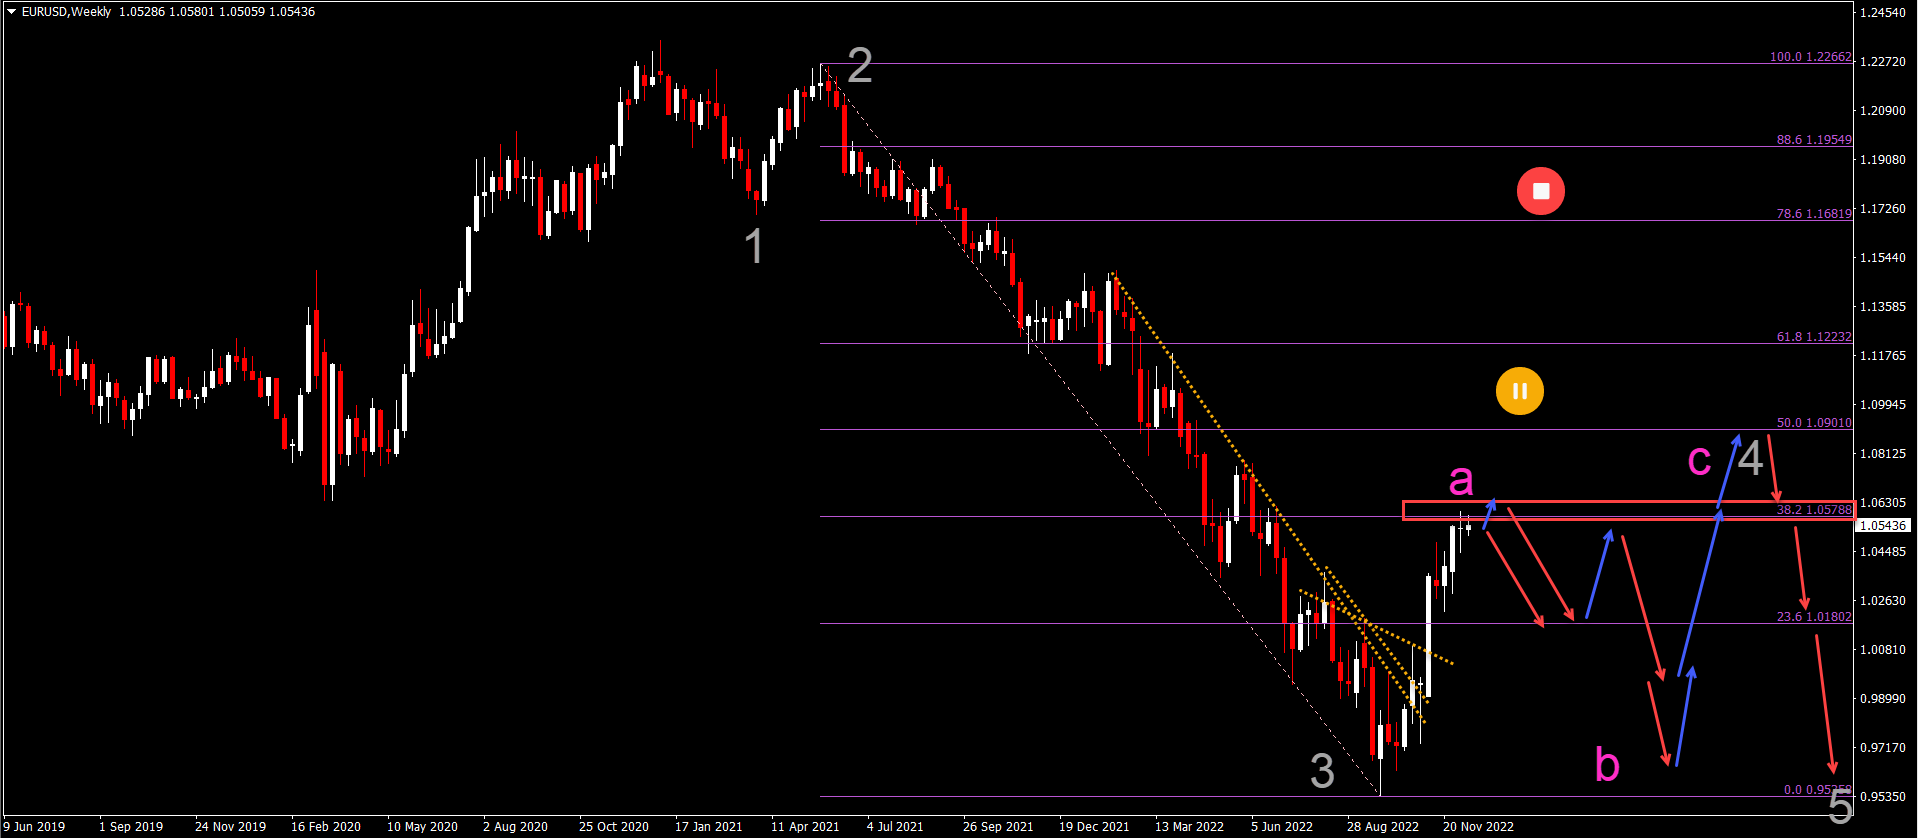
EUR/USD Weekly Doji Candle at 38.2% Fib Resistance
The EUR/USD showed a Doji weekly candlestick pattern at the 38.2% Fibonacci retracement level:
- The EUR/USD weekly Doji indicates indecision at the strong 38.2% Fib resistance.
- There is also a small rising wedge reversal chart pattern visible on the 4 hour and daily chart.
- A bearish bounce (red arrows) could confirm the end of a wave A (pink) of wave 4 (gray)
- A small bullish push up (blue arrow) could still be part of a wave A (pink) as long as price action stays below 1.0750.
- A bearish ABC could take place within wave B (pink).
- The ABC (pink) could complete a wave 4 (gray) after which a new downtrend could emerge in wave 5 (gray).
ATHENA EA
#H1
#H4
#Time frames
Award Winning Momentum TradingPromo
Yearly Target:
220%
Risk/Reward:
0.36
Platforms:
MT4
Historical Drawdown:
30%
Min. Deposit:
50$
Asset Types:
Forex

Presented by
Chris Svorcik
Verified on:
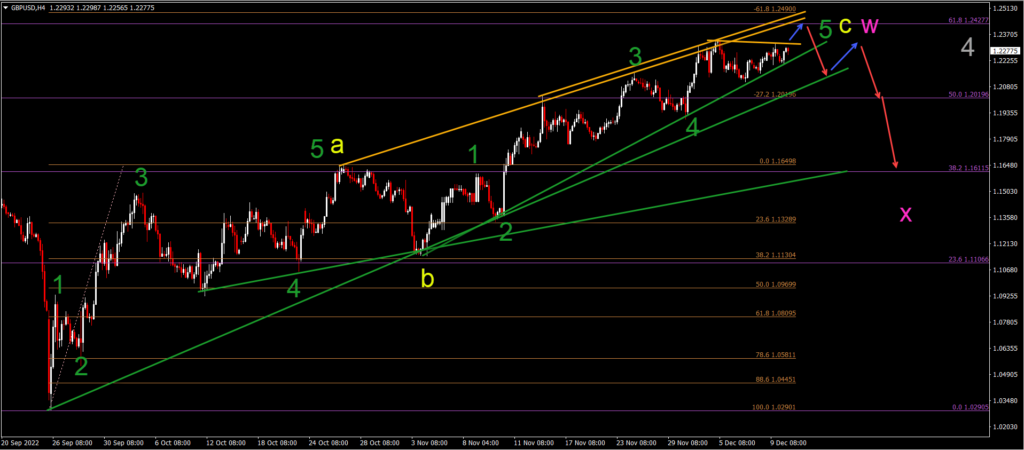
GBP/USD Approaches Key Golden 61.8% Fibs near 1.25
The GBP/USD is approaching two strong Fibonacci targets and the strong round resistance level of 1.2250-1.25 after a spectacular 2,000 pip rally:
- The GBP/USD seems to be completing a bullish ABC (yellow) pattern.
- The 61.8% Fibonacci retracement (purple) level and -61.8% Fibonacci target (brown) level at 1.2425-1.25 could be the main target for the wave C (yellow).
- A break above the local resistance line (orange) could indicate one more push higher (blue arrow) towards that target zone.
- Eventually, a larger bearish retracement is expected to take place (red arrows) once price action completes the ABC (yellow) of wave W (pink).
- A WXY (pink) correction is expected within the wave 4 (gray).
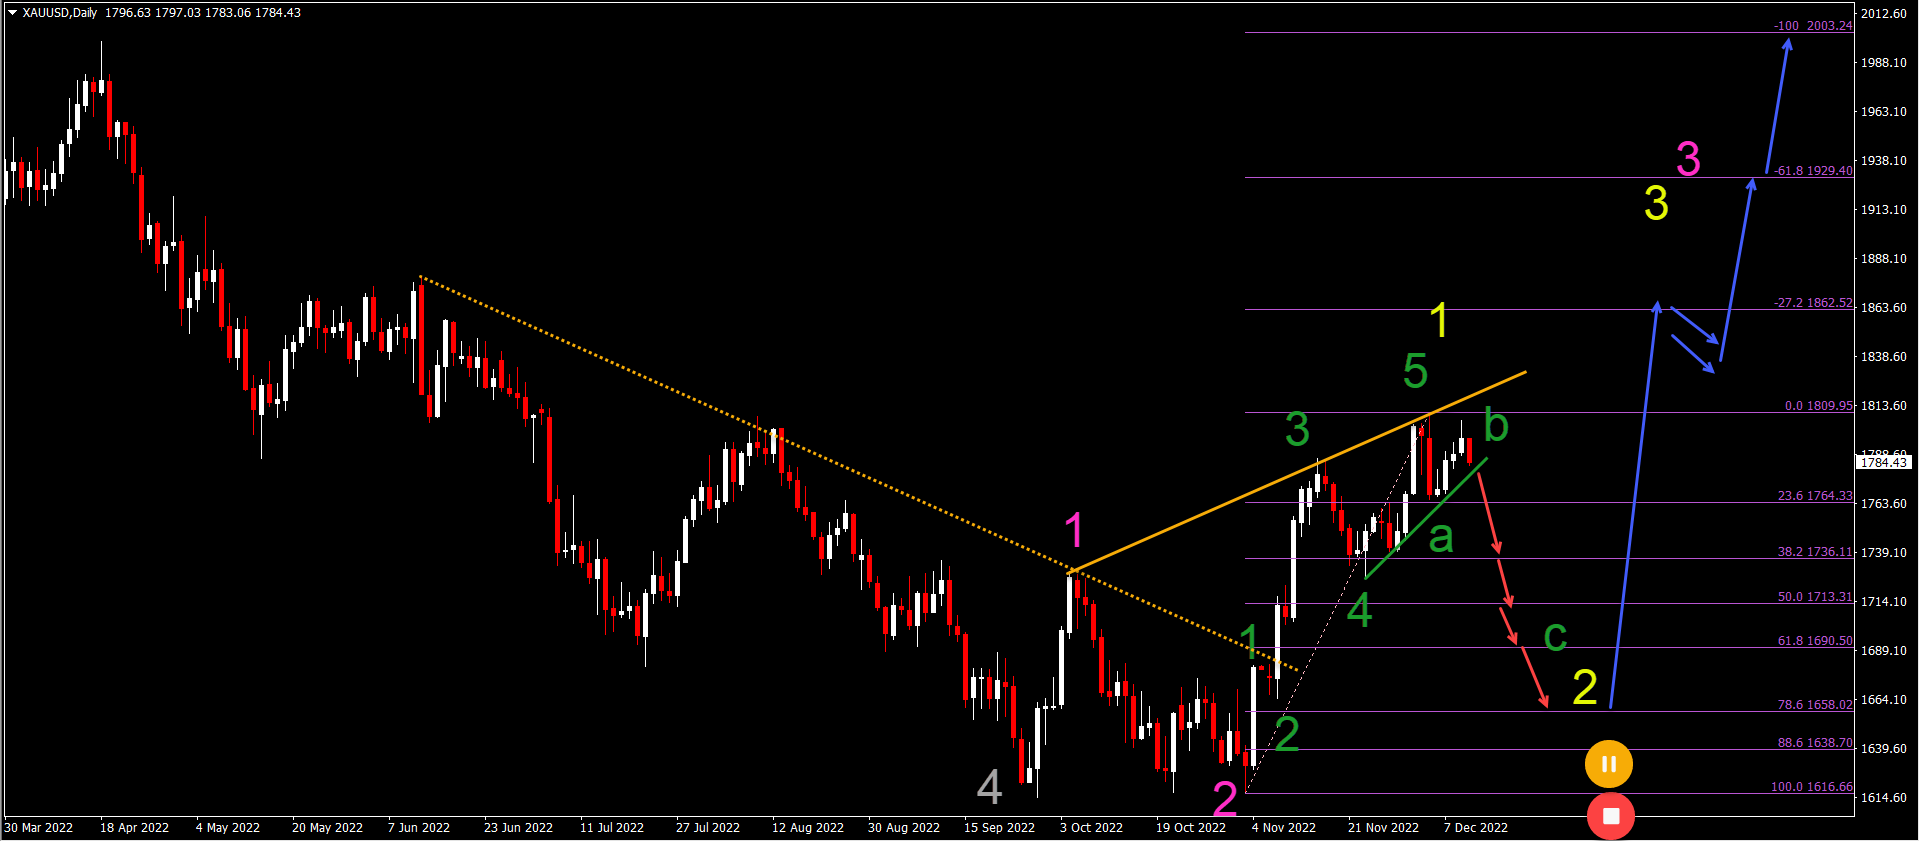
Gold Rally Requires Bearish Pullback
Gold (XAU/USD) is making a nice rally but has failed to show a higher high in the past few days:
- The lack of a higher high and a rising wedge reversal chart pattern (trend lines) could indicate the end of the bullish price swing.
- In that case, price action seems to have completed a 5 wave pattern (green) in wave 1 (yellow).
- A break below the support trend line (green) could indicate an ABC (green) retracement within the wave 2 (yellow).
- The wave 2 (yellow) remains valid as long as price action remains above the 88.6% Fibonacci level and most importantly, the previous bottom.
- A bullish bounce (blue arrows) at the FIbonacci retracement levels could see price action make a bullish rally towards the Fibonacci targets within waves 3.
Good trading,
Chris Svorcik


Leave a Reply