Weekly Waves 12 Apr: EUR/USD, Bitcoin and Gold
April 12, 2022
4 min read
Subscribe
Hi Traders,
our weekly Elliott Wave analysis reviews the EUR/USD monthly chart, the Bitcoin crypto currency daily chart, and XAU/USD on the daily chart.
EUR/USD Faces Decisive Support Zone
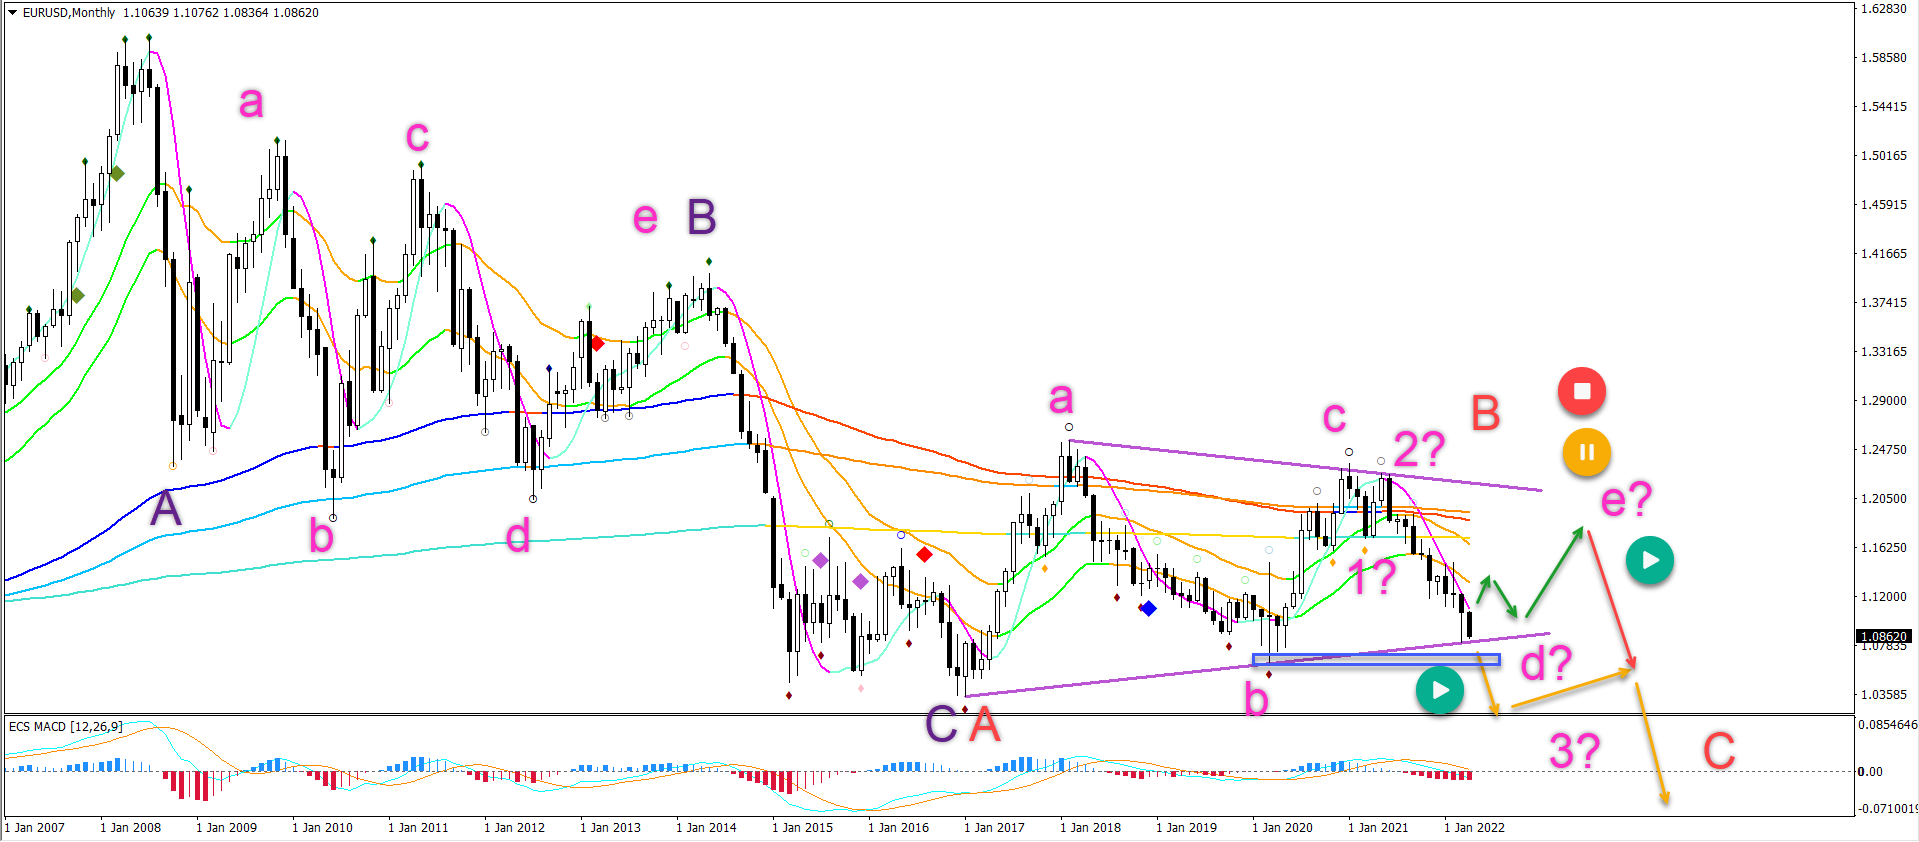
The EUR/USD monthly chart is testing a key support zone and trend line (green):
- The EUR/USD is facing a decisive moment: will price action break or bounce?
- The EUR/USD bullish bounce would confirm a potential ABCDE (pink) triangle pattern within wave B (red).
- Price action needs to break above the opening of this month and last month’s high. An ABC up could be expected within wave E (pink).
- The EUR/USD bearish breakout would indicate an immediate downtrend. In that case, price action completed an ABC (pink) correction and is making a decline within a 123 (pink) of wave C (red).
ATHENA EA
#H1
#H4
#Time frames
Award Winning Momentum TradingPromo
Yearly Target:
220%
Risk/Reward:
0.36
Platforms:
MT4
Historical Drawdown:
30%
Min. Deposit:
50$
Asset Types:
Forex

Presented by
Chris Svorcik
Verified on:
BTC/USD Bearish Swing to Rebound at Fibs
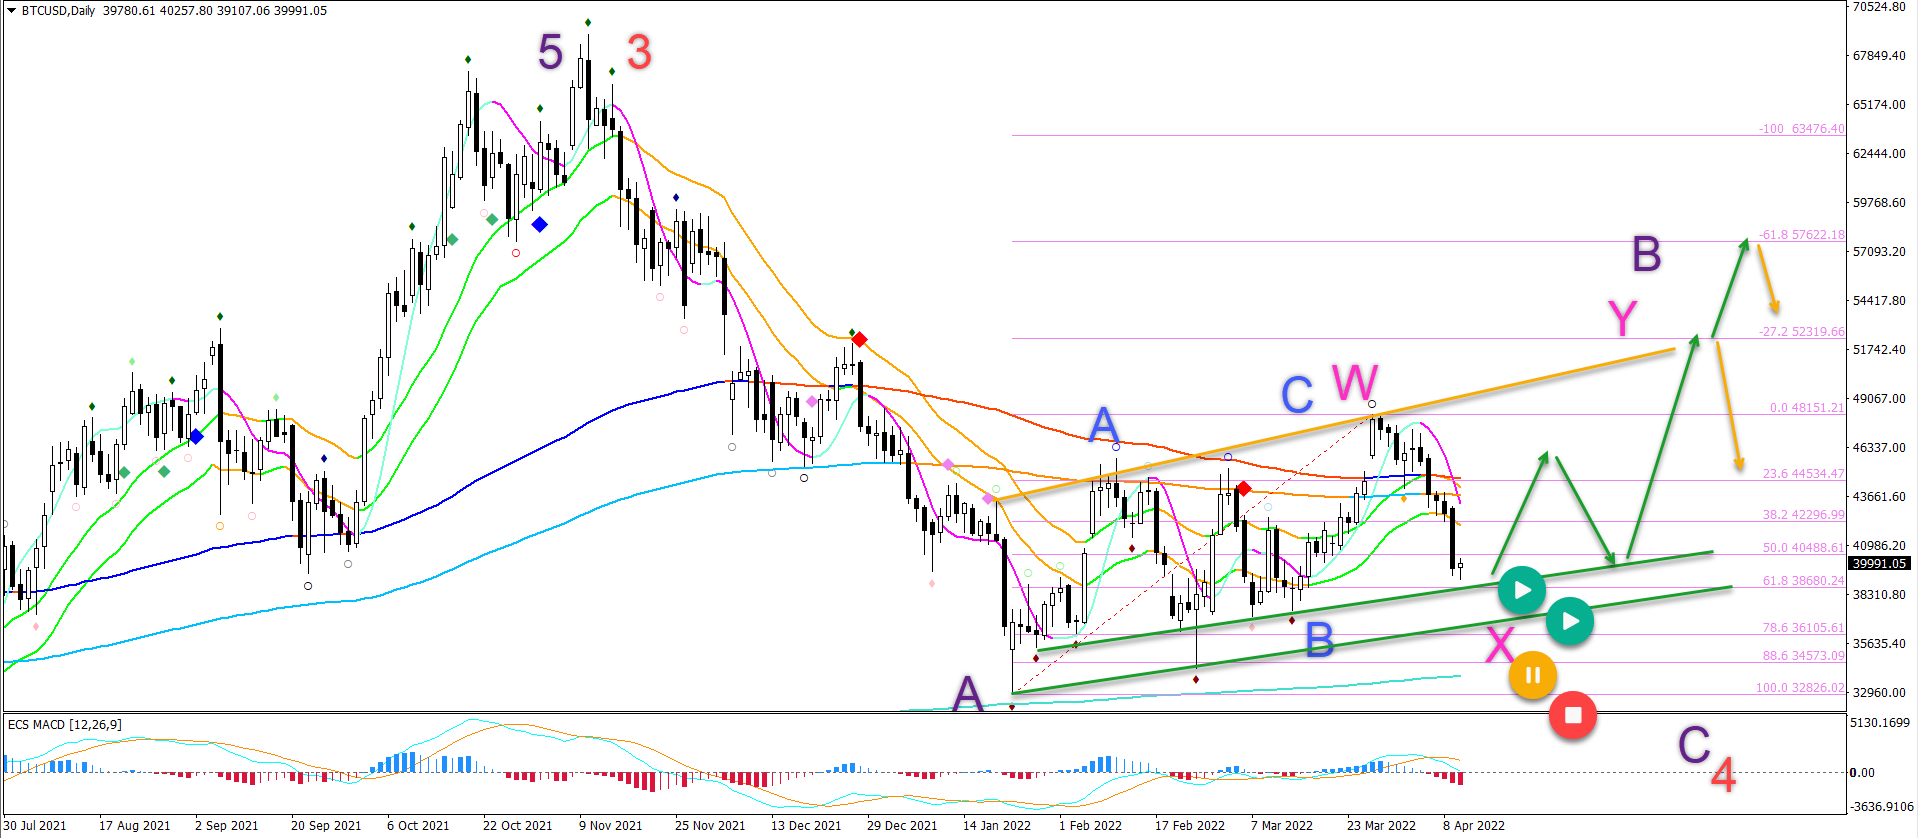
Bitcoin has made a small bearish reversal. Is the crypto currency looking for a downtrend or for a bounce, let’s review:
- The BTC/USD made a bearish reversal, which means that the bullish pattern is probably an ABC (blue) pattern.
- However, we expect price action to develop a larger bullish correction within wave B (purple).
- Therefore, a bullish and expanded WXY (pink) pattern is the current favorite Elliott Wave pattern in wave B (purple).
- A bullish bounce at the Fibonacci support levels would confirm it.
- But a bearish breakout below the support zone would indicate it.
- The main targets are located at the Fibonacci targets.
Gold Pushing for a Bullish Breakout
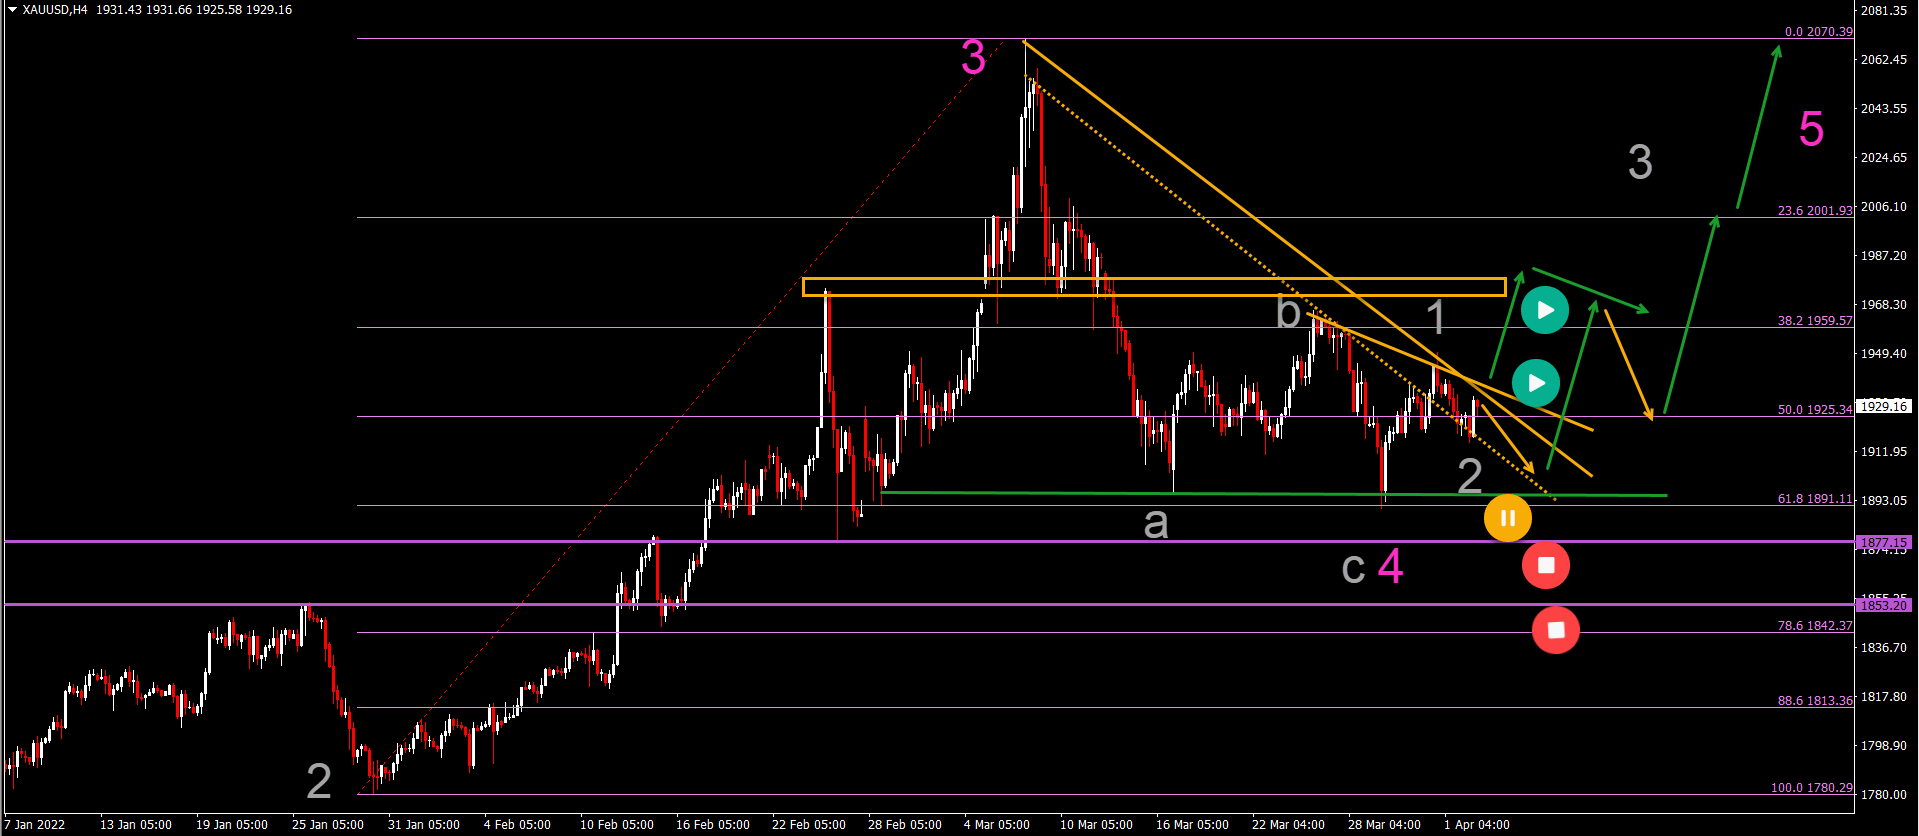
The XAU/USD has made a bullish bounce and is now testing the resistance:
- The XAU/USD made a strong push up for a wave 3 (blue).
- The retracement is probably a wave 4 (blue), although the wave 4 can be extended and complete itself at a later moment in time (blue 4’).
- A breakout (green arrows) above the resistance (orange) could indicate an attempt to test the previous top.
- A break below the previous tops (blue boxes) would invalidate the bullish outlook.

Good trading,
Chris Svorcik


Leave a Reply