? USD/JPY Triangle Patterns Indicates Breakout Above 110 Level ?

Dear traders,
the USD/JPY is building a triangle chart pattern in front of the previous top. Although the resistance zone remains dangerous, a bullish breakout is expected.
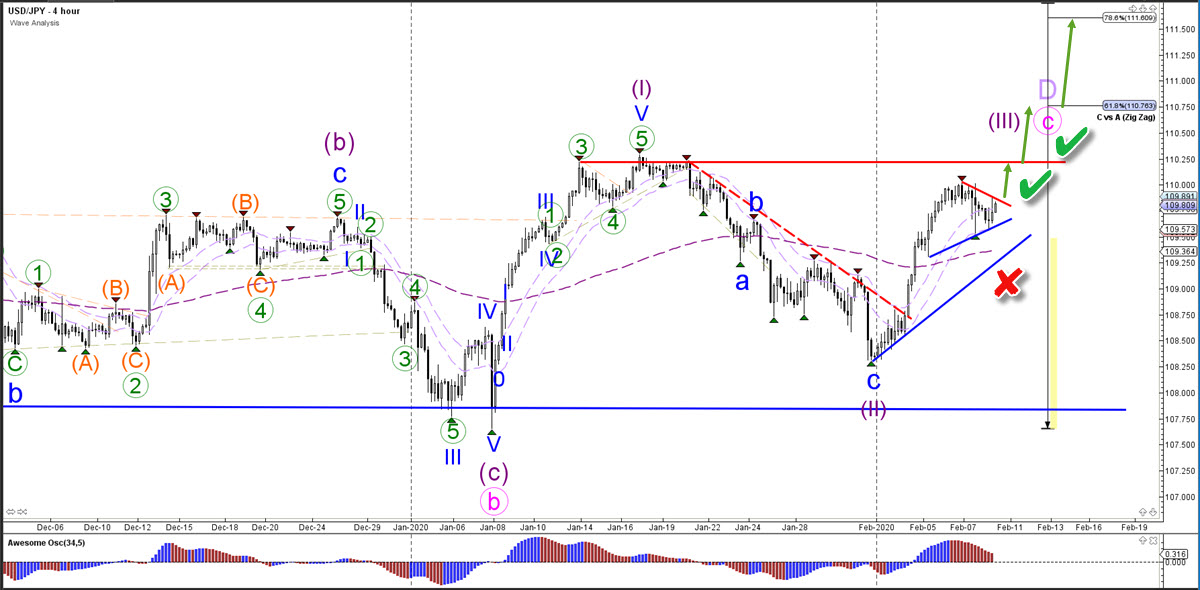
USD/JPY
4 hour
The USD/JPY breakout above the triangle pattern resistance and the previous top could confirm (green check) the push higher towards the Fibonacci targets of wave C vs A. A break below the support trend line (blue) and the long-term moving averages could invalidate (red x) the wave outlook.
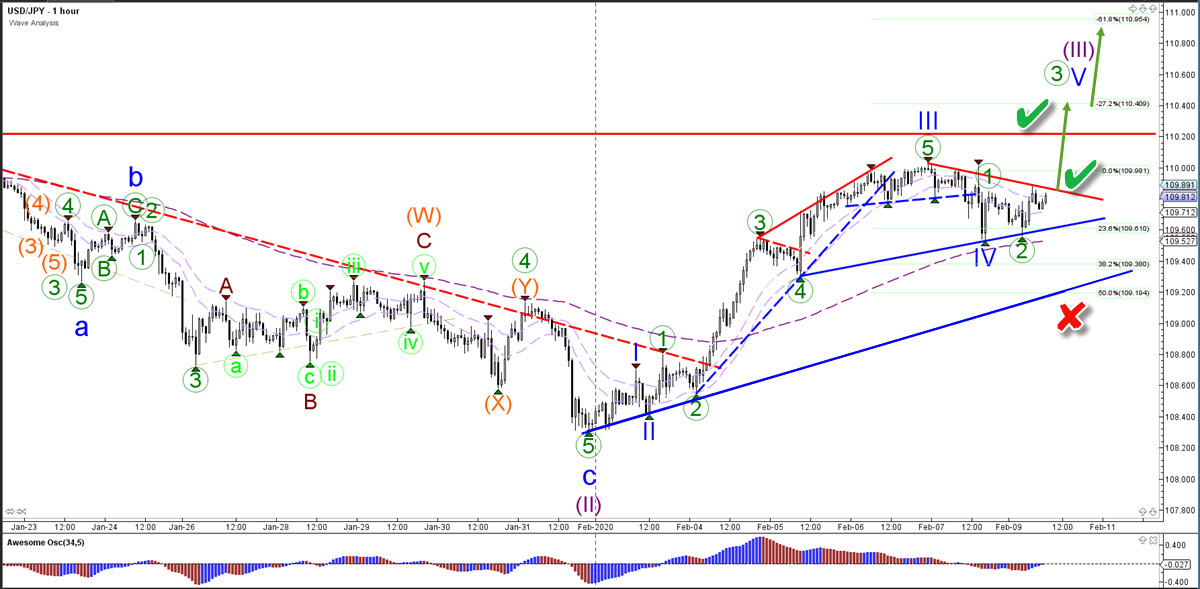
1 hour
The USD/JPY is building a bearish pullback after building a rising wedge reversal chart pattern. The shallow retracement could confirm a wave 4 (blue) pattern. The bullish breakout (green check) above the resistance (red) could indicate the start of a wave 5 (blue) pattern.
The analysis has been done with SWAT method (simple wave analysis and trading).
For more daily wave analysis and updates, sign-up up to our ecs.LIVE channel.
Good trading,
Chris Svorcik
Elite CurrenSea


Leave a Reply