? USD/JPY Starts Wave 5 after Breaking Wave 4 Triangle ?
July 18, 2018
2 min read
Subscribe
Hi traders,
The USD/JPY broke above the resistance trend line (dotted red) of corrective triangle chart pattern. The bullish breakout indicates a continuation higher towards the -27.2% Fibonacci target at 113.23.
USD/JPY
4 hour
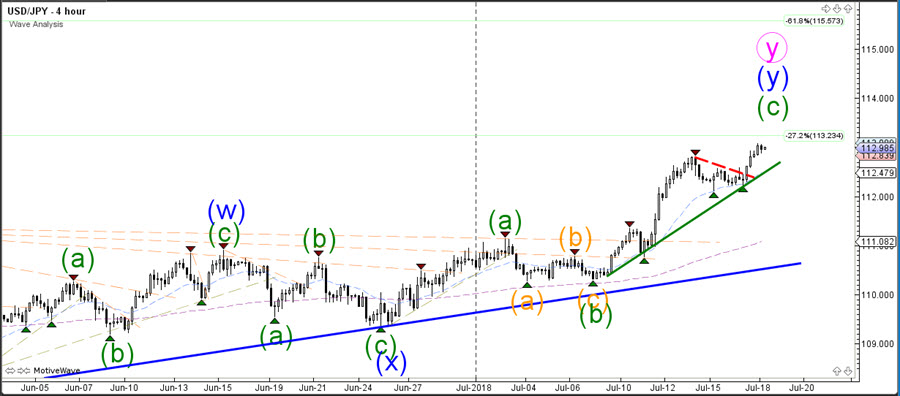
The USD/JPY bullish momentum could also extend the wave C (green) of waves Y to the -61.8% Fibonacci target if price manages to break above the first Fib target.
1 hour
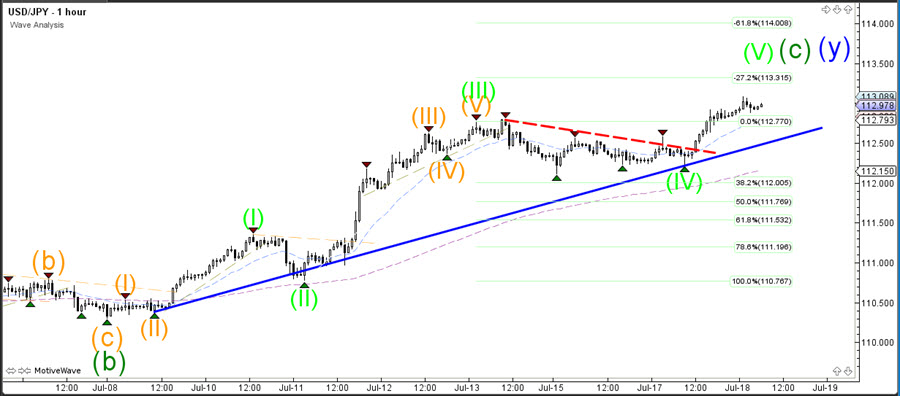
The USD/JPY bounced at the 38.2% Fibonacci retracement level and is now building a bullish wave 5 (green) within wave C (green). Price could extend the bullish momentum with 5 inner waves within wave 5 (green).
Good trading,
Chris Svorcik
Elite CurrenSea


Leave a Reply