? USD/JPY Rising Wedge Indicating End of Bullish Wave 3 of C ?


Dear traders,
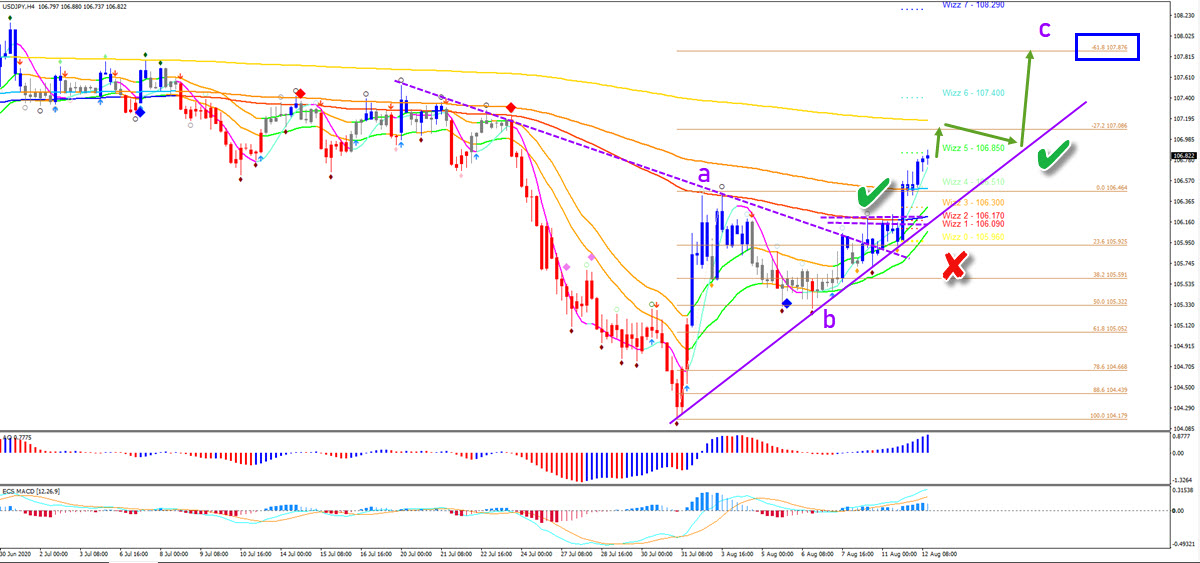
the USD/JPY is building a strong bullish rebound. The 3rd swing is probably a wave C (purple) of a larger ABC zigzag pattern. This remains valid unless price breaks above the main -61.8% Fibonacci target (blue box).
USD/JPY
Price Charts and Technical Analysis
The higher high on the USD/JPY is aiming first at the -27.2% Fibonacci target. This zone could create a pullback and continuation towards the -61.8% Fib target. This currency pair remains in an uptrend on the 4 hour chart as long as price remains above the 21 ema zone.
On the 1 hour chart, the USD/JPY is showing strong bullish momentum within that wave C. This is clearly visible due to the ability of price action to move away from the 21 ema zone (blue candles). Price might be running out of steam though at the moment, as a rising wedge chart pattern (purple lines) is being built. Any pullback could confirm a wave 4 (orange) pattern. Price is expected to bounce around the 21 ema zone.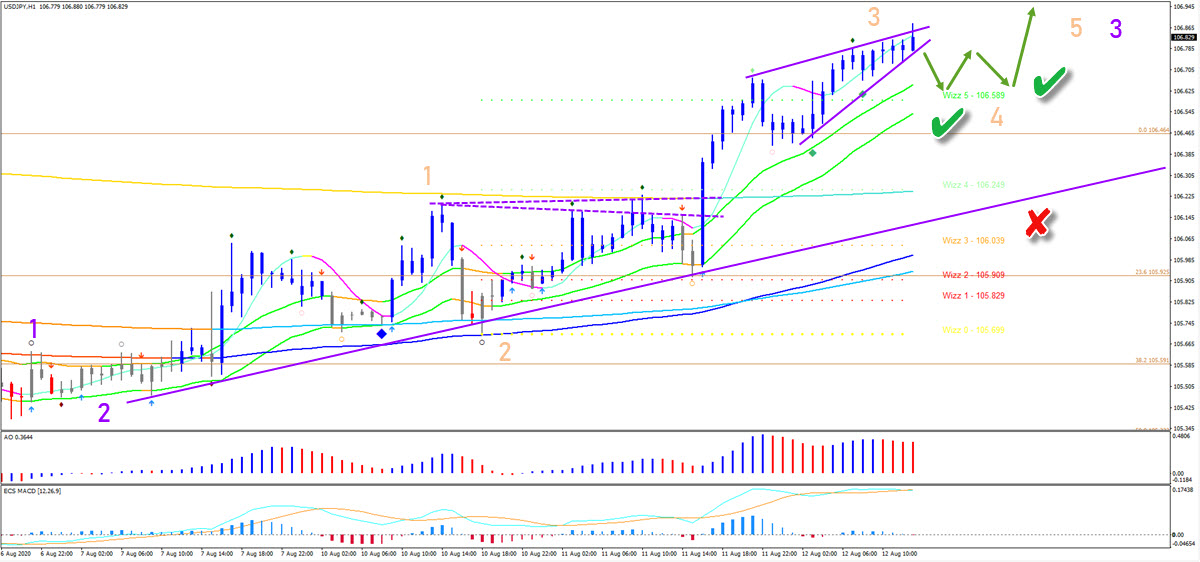
The analysis has been done with SWAT method (simple wave analysis and trading).
For more daily technical and wave analysis and updates, sign-up up to our newsletter.
Good trading,
Chris Svorcik
Elite CurrenSea


Leave a Reply