? USD/JPY Bullish Breakout Slams into 61.8% Fib Resistance ?
Subscribe
Hi traders,
The USD/JPY broke above the resistance trend lines (dotted orange) and made a bullish breakout which is now approaching a critical 61.8% Fibonacci level. This Fib is again a new decision zone and offer again a bounce or break spot.
USD/JPY
4 hour
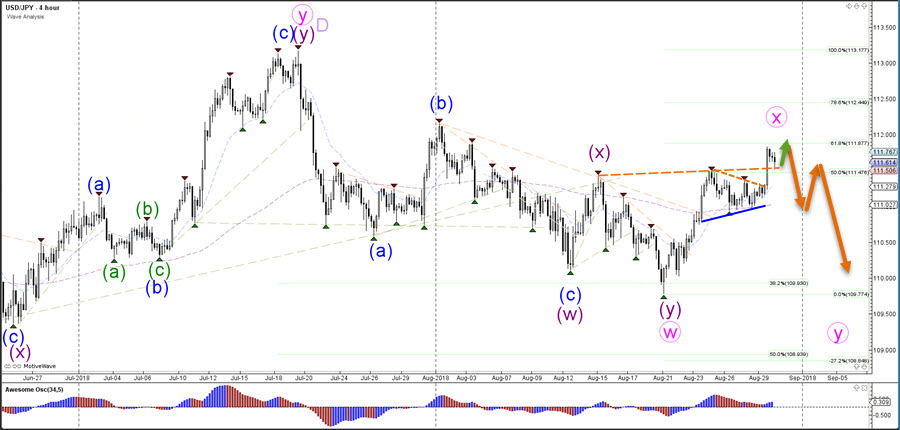
The USD/JPY is expected to make a bearish bounce at the 61.8% Fibonacci retracement level and complete a wave X (pink). A bearish turn could indicate the start of a wave Y (pink).
1 hour
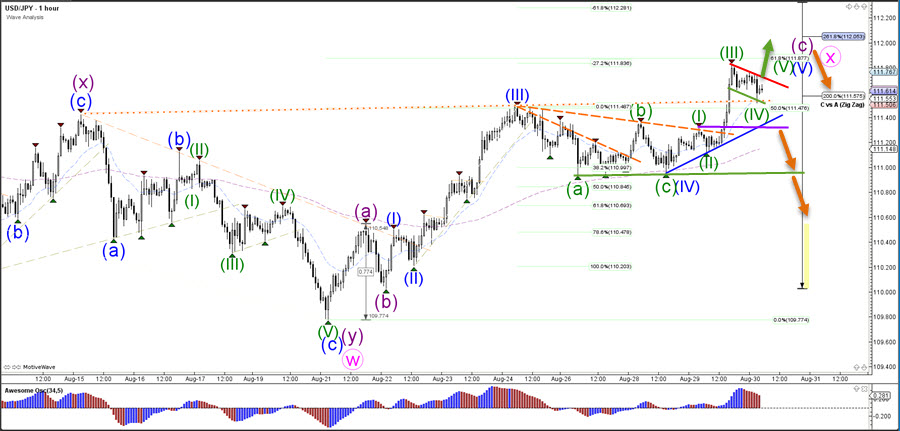
The USD/JPY completed a bearish ABC (green) as expected in wave 4 (blue) after which price made a bullish breakout. This bull momentum is probably a wave 3 (green) and the current pullback is a bull flag chart pattern within a wave 4 (green) unless price breaks below the top of wave 1 which is indicated by the purple line. A break above resistance (red) could see one more wave 5 to finish wave C.
Good trading,
Chris Svorcik
Elite CurrenSea


Leave a Reply