? USD/JPY Bearish ABC Zigzag Pattern Aims at 61.8% Fib ?

Dear traders,
the USD/JPY made a bearish bounce at the top of the bullish channel. This could confirm the start of the final wave E of a larger triangle pattern.
USD/JPY
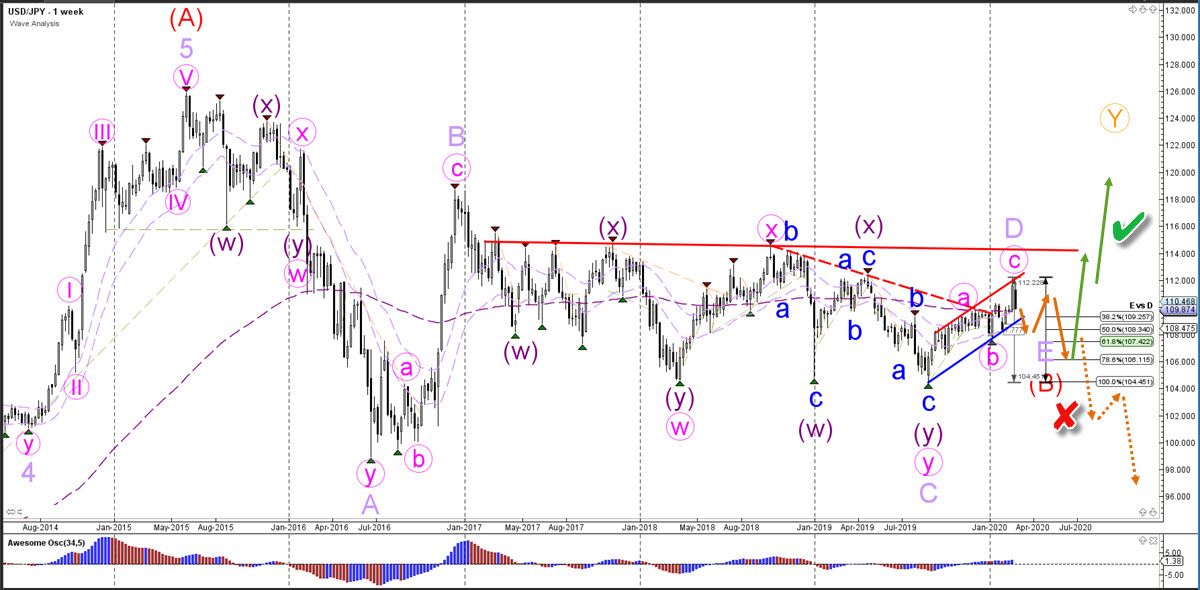
Weekly Chart
The USD/JPY could be building a bearish ABC zigzag pattern within wave E (purple) of wave B (red). The ABCDE triangle chart pattern (purple) could become invalidated (red x) if price action breaks below the bottom and 100% Fibonacci level.
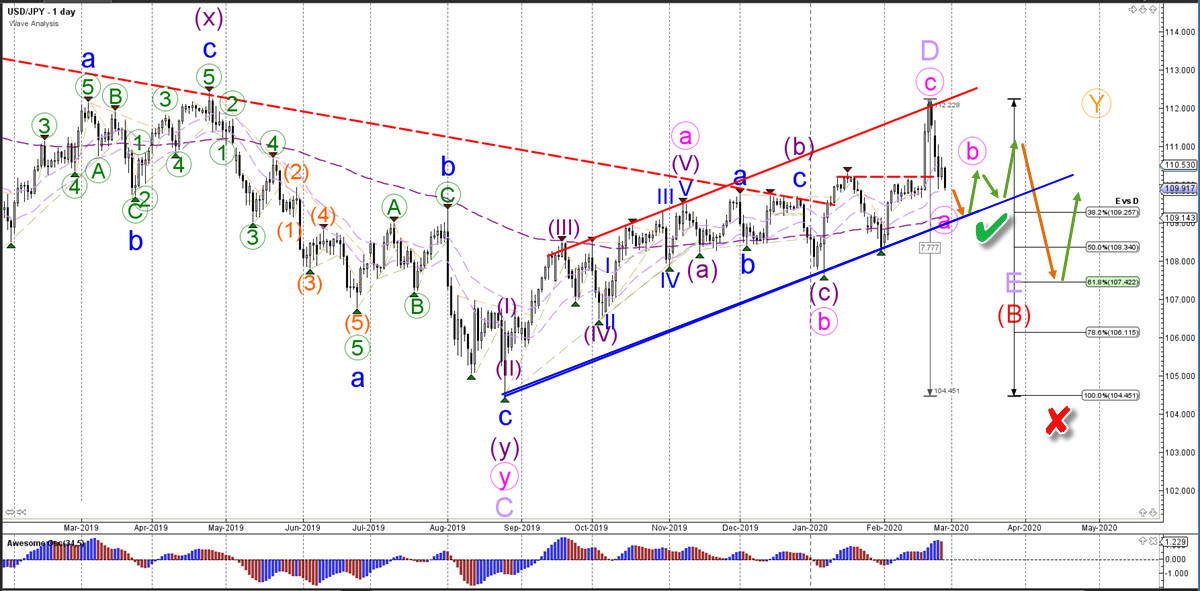
Daily Chart
The USD/JPY is likely to test the support line (blue) of the uptrend channel. A bullish bounce could indicate the end of wave A (pink) and the start of a wave B. A bearish breakout confirms (green check) the move lower towards the Fibonacci support of wave E vs D.
The analysis has been done with SWAT method (simple wave analysis and trading).
For more daily wave analysis and updates, sign-up up to our ecs.LIVE channel.
Good trading,
Chris Svorcik
Elite CurrenSea


Leave a Reply