? USD/JPY Approaches Critical Decision Zone at 109 Level ?
Subscribe
Dear traders,
the USD/JPY broke above the resistance trend line (dotted red), which could indicate a bullish reversal or an expanded bullish correction within wave 4 (blue). The FOMC on Wednesday 11 December 2019 is expected to have a substantial impact.
USD/JPY
4 hour
The USD/JPY main decision zone is the round level of 109. A bullish break above that could invalidate (red x) the wave 4 (blue) pattern whereas a bearish bounce could confirm it and send the pair lower. A bearish breakout below the support (blue) lines could further confirm (green check) the bearish outlook towards the Fibonacci targets of wave B vs A, with the 61.8% Fib as the main target (red circle).


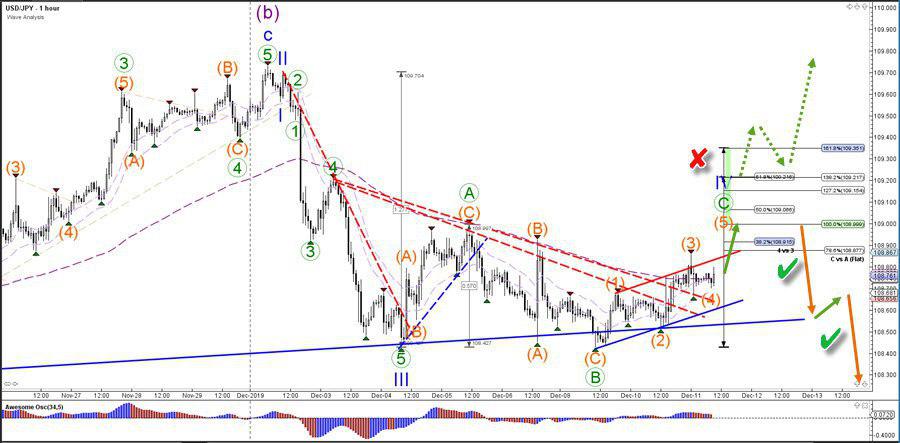
1 hour
The USD/JPY could be building 5 waves (orange) within the wave C (green) of wave 4 (blue). A bearish bounce at the 38.2% or 50% Fibonacci retracement level is most common for a wave 4 (blue) whereas a break above the 61.8% Fib makes a wave 4 (blue) less likely (red x). A bounce and breakout could confirm (green checks) the bearish outlook.

For more daily wave analysis and updates, sign-up up to our ecs.LIVE channel.
Good trading,
Chris Svorcik
Elite CurrenSea


Leave a Reply