S&P 500 – Still More Room Left to Go
Subscribe
Dear Traders,
the S&P 500 has climbed to new highs and probably extended its final multi-week swing to the upside. Today’s post will provide an updated short-term and medium wave analysis for this major US index.
Impulse Still Incomplete to the Upside
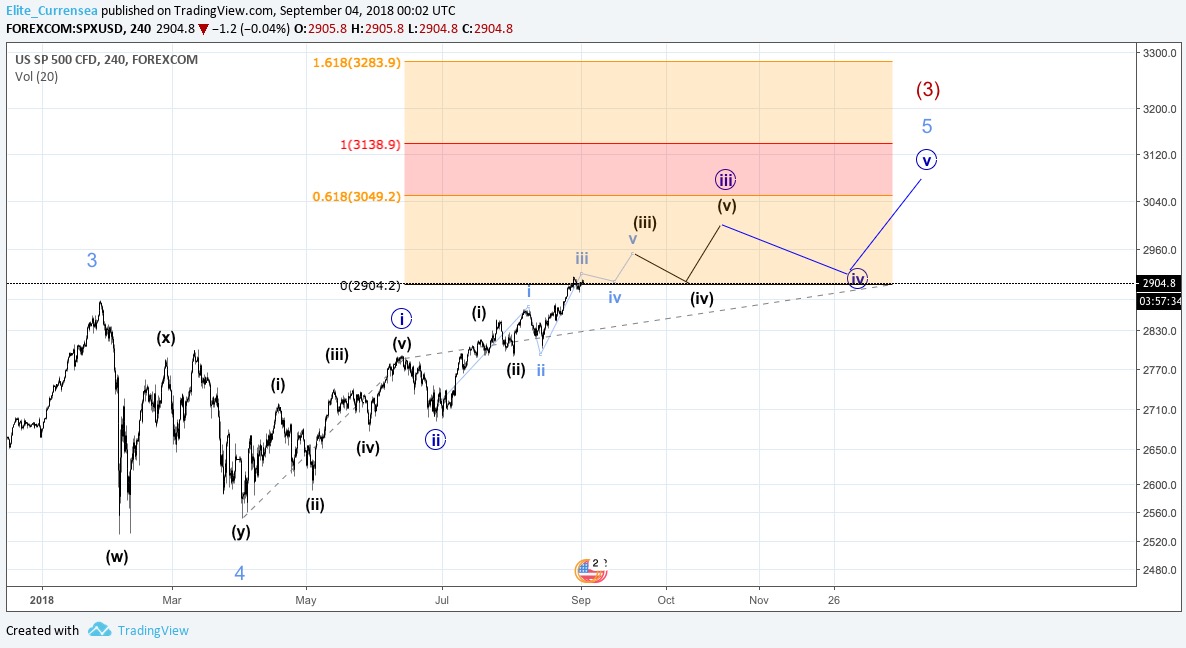
The S&P has climbed to new record highs in an interesting fashion. Even though a major high seemed still closer a short few weeks ago, the price action has now morphed into a pattern that suggests the incompleteness of several sub-waves within its larger uptrend before a lid can be placed on the index for a more significant amount of time.
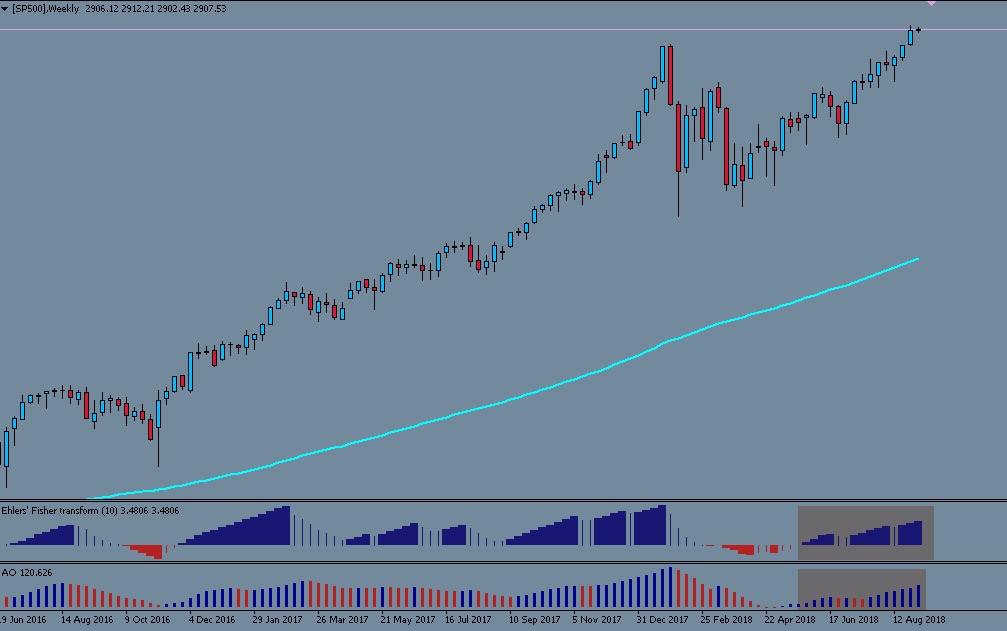
The chart above shows my currently preferred wave count, which leaves three internal waves of Minor wave 5 unfinished before a longer-term high will be in place. Internal wave size relationships make this a higher possibility scenario than a more swift end of the uptrend. In addition, the AO and ECS Fisher momentum indicators show a familiar combined reading that is suggestive of a wave 3 which is still incomplete since June 2018 (see chart below).
I therefore expect a progressively more choppy continuation to the upside over the coming weeks, whereby the corrective phases will become increasingly bigger and longer while any ground gained will become smaller and slower.
All the best long your trading journey
Hubert
.


Leave a Reply