NZD/USD ?Rising Wedge Indicates Bearish Correction ?
January 23, 2018
2 min read
Subscribe
Dear Traders,
The NZD/USD continues to grind higher. But momentum is waning and price-action is showing further signs of a potential correction.
This analysis will take a quick look at the most recent price-action of the NZD/USD
Possible Wedge Forming As Ending Structure
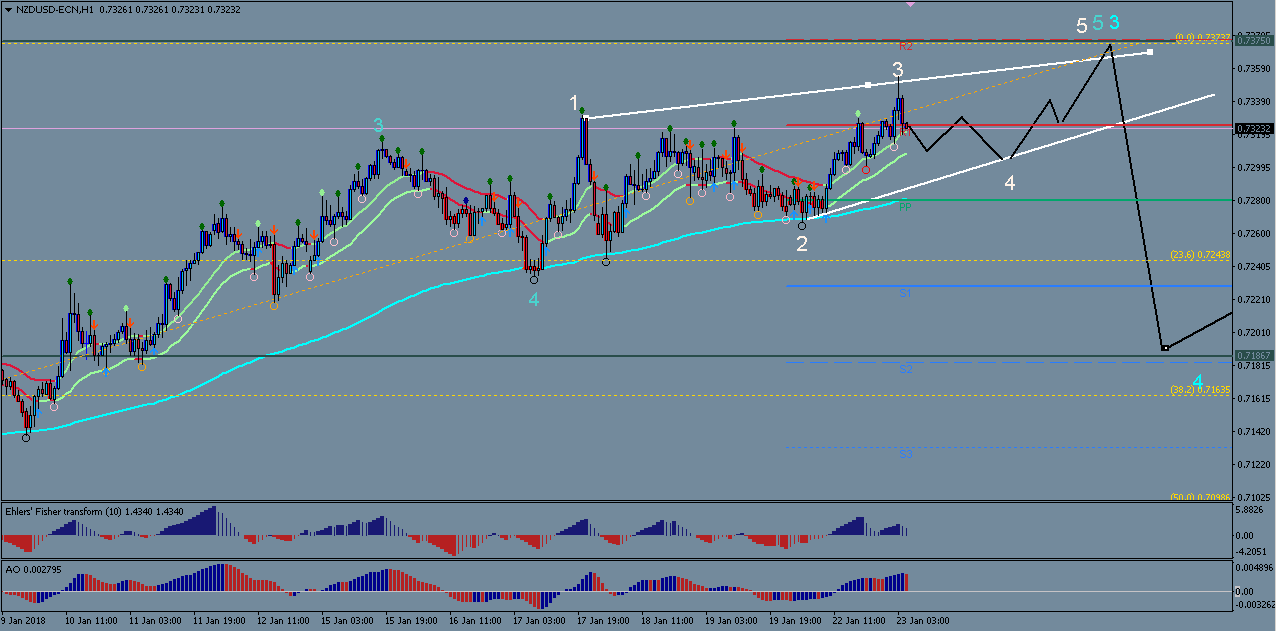
The NZD/USD remains bullish, but several factors point towards at least a temporary correction now:
- Confirmed 4hour chart divergence
- distinctly slowing momentum and repeated dips below the 21 EMA
- Price approaching strong historic resistance level at around 0.7375
- Price could be in the process of forming a rising wedge/ending diagonal chart pattern, that would complete Wave 5 of the recent upwards thrust (see chart above). This is not yet confirmed, so watch price for 3-wave zig zags as part of wave 4 and 5. Also note that if price breaks sharply below the 21 EMA of the 4-hour chart, the correction may already go into full swing without tracing out the wedge pattern.
- Invalidation of this analysis would occur if price breaks AND closes above 0.7375, with a strong 1hour or 4 hour bullish candle close. But a quick hit at, or slightly above, 0.7375 with quick bearish reversal could provide further confirmation for the rising wedge scenario.
- Possible targets for a bearish correction could be 0.7200 (modest), 0.7175 – 60 (38.2 fib), and 0.7100 (50% fib).
All the best along your trading journey
Hubert
Fibonacci Trading & Wizz Tool
Start using to know when and where price is expected to accelerate
and show strong momentum.
.


Leave a Reply