🔍 Gold Triangle Turns Bearish but Bulls Can Hope for Reversal 🔍
Dear traders,
the Gold (XAU/USD) broke the triangle chart pattern to the downside rather than to the expected upside. Price action is now building a bearish retracement but key support zones could send it in reverse again. Let’s review the key S&R zones and next price swings for Gold.
Price Charts and Technical Analysis
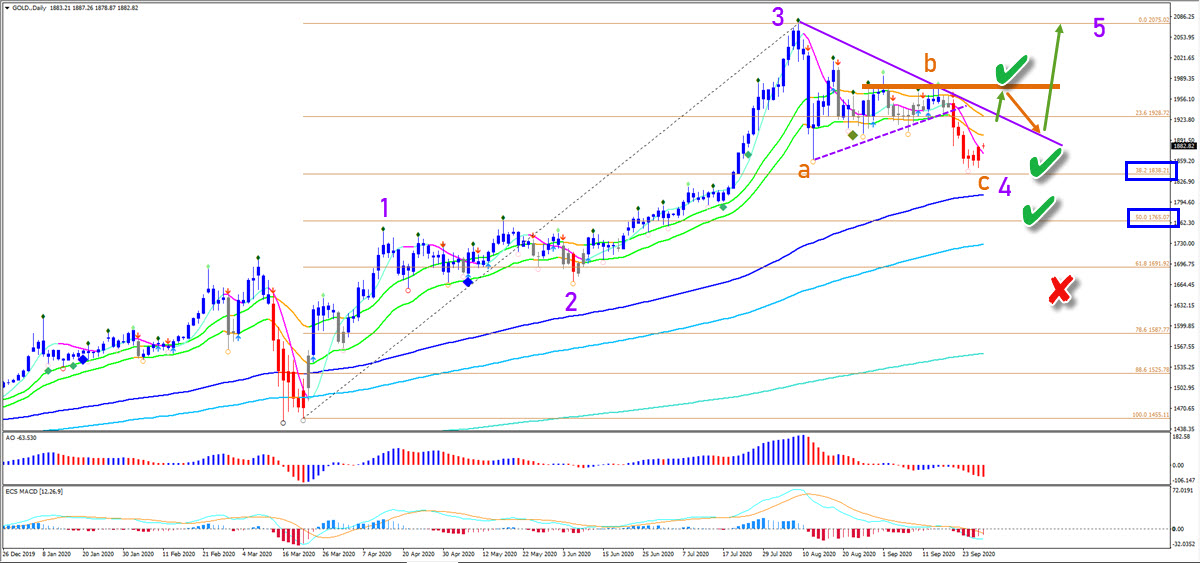
The XAU/USD daily chart remains in a strong uptrend due to the large space between the long-term moving averages despite the bearish pullback. Price has now reached and bounced at the 38.2% Fibonacci of the entire price swing (blue box). When we would add the Fib to the wave 2-3 price swing, then price action is at the 50% Fib. This is a key support zone (green checks) for the bulls. Any push below $1700 would make the current expected wave 4 (purple) less likely (red x). Price needs to break the resistance (orange box) to confirm the uptrend continuation.
The 4 hour chart seems to be completing a wave 5 (orange) of wave C (purple). This could complete a larger bearish ABC (purple) correction after the triangle pattern turned out to be bearish when price action broke the support trend lines. Now price action needs to test the 21 ema zone, confirm a higher low, and break above the local resistance (orange box) to confirm the bullish reversal.

The analysis has been done with the indicators and template from the SWAT method (simple wave analysis and trading). For more daily technical and wave analysis and updates, sign-up to our newsletter.
Good trading,
Chris Svorcik


Leave a Reply