🚀 Gold Triangle Chart Pattern Developing Key Wave 1-2 Breakout 🚀
Dear traders,
the XAU/USD (Gold) has been building a contracting triangle chart pattern for a long time. Will the continuation pattern indeed break to the upside as expected? Or will the price pattern fail and break lower for a deeper retracement?
Price Charts and Technical Analysis
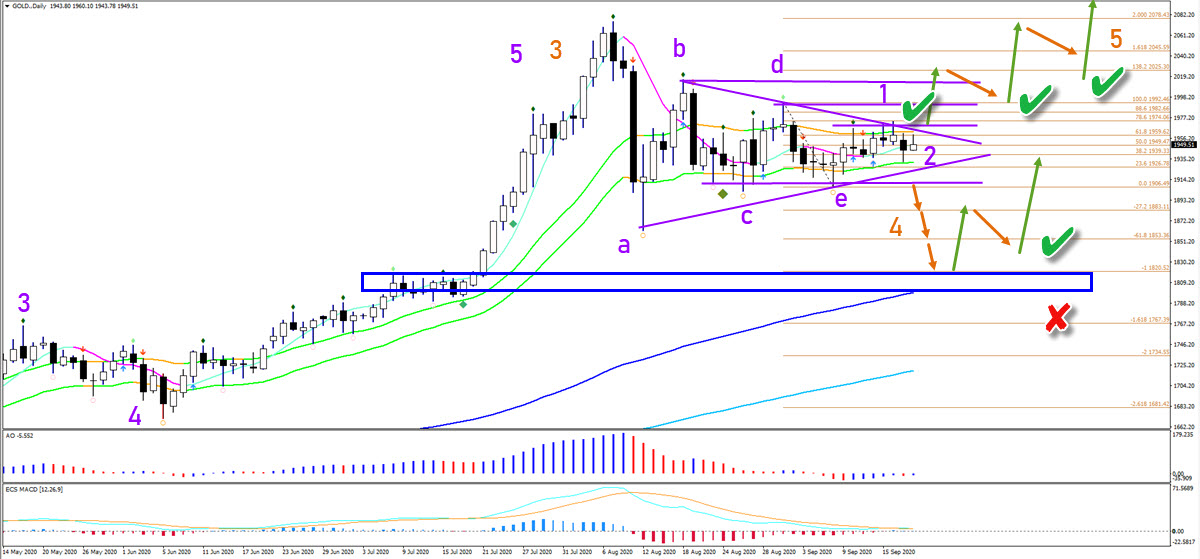
The XAU/USD triangle pattern looks like a classical triangle chart pattern and therefore, the triangle usually breaks higher. From my experience, about 70% of these patterns do break above the resistance of the pattern. A push above the resistance Fractals would confirm the bullish breakout (green check). The first target is the 138.2% Fibonacci level, which could cause a pullback. A bullish bounce at approximately the previous top could setup a full uptrend that challenges and perhaps breaks above the previous top. However, a break below the support Fractal could set in motion a deeper correction. The main target in that case is the previous support zone (blue box), the 144 ema, and the -61.8% and -100 Fibonacci targets.
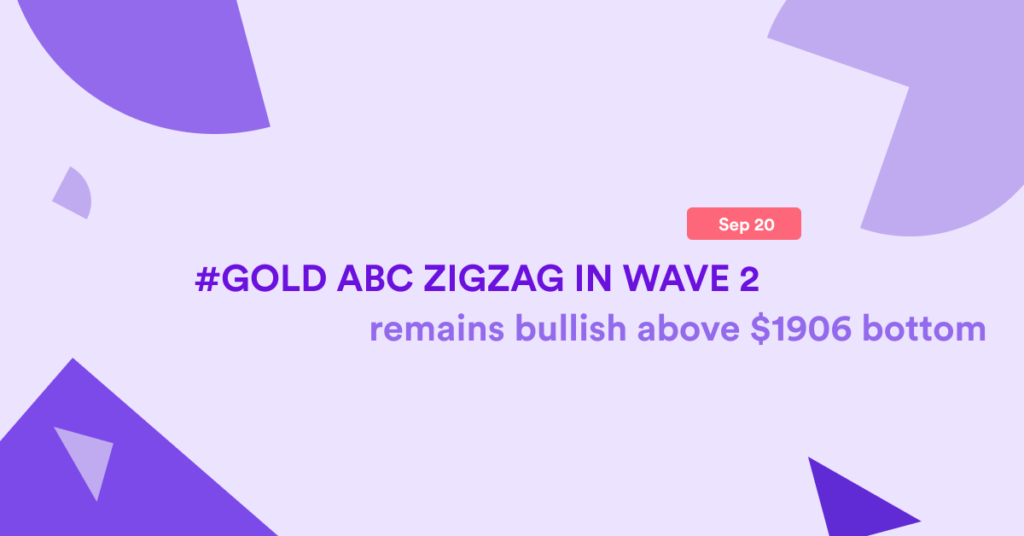
On the 4 hour chart our Elliott Wave software is showing grey indecision candles. The current wave 1-2 (purple) remains viable as long as price action stays above the bottom of wave 1 (blue box). A break below that support invalidates (red x) the bullish outlook and indicates a downtrend. Otherwise, price action seems to be building a potential ABC (orange) pattern within the wave 2 (purple). A bullish breakout above the double top could send Gold higher, finally.

The analysis has been done with the indicators and template from the SWAT method (simple wave analysis and trading). For more daily technical and wave analysis and updates, sign-up to our newsletter.
Good trading,
Chris Svorcik


Leave a Reply