🎯 Gold Prepares for Massive Bullish Trend but Break Needed 🎯

Dear traders,
the XAU/USD (Gold) chart is showing the end of an ABCDE triangle pattern (green). This could complete a wave 4 (blue) retracement and restart the uptrend. What is the key breakout zone for the bulls?
Price Charts and Technical Analysis
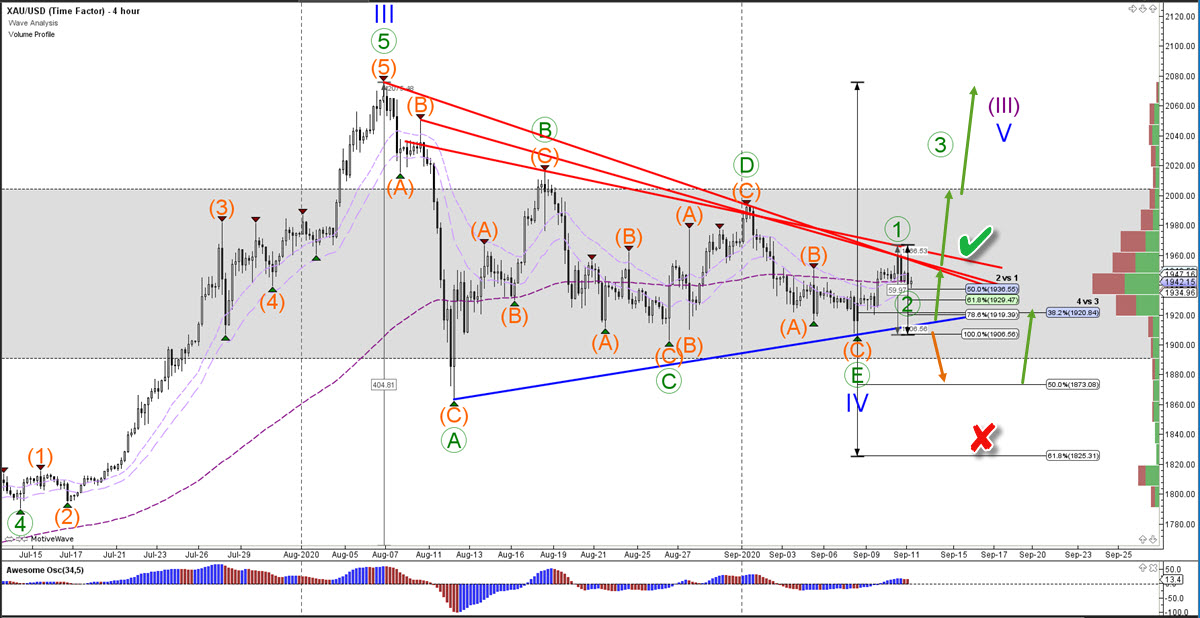
Gold needs to make a bullish break above the resistance trend lines (red) to confirm the upside (green check). There is not much resistance ahead from a volume point of view once the breakout occurs. Although the tops of wave B and D remain sub levels to be aware of. The current wave 1-2 pattern remains valid as long as price stays above the Fib levels of 2 vs 1. A break below the 100% Fib could indicate a deeper retracement first within the larger uptrend.
Although Gold has probably completed the triangle pattern, the wave C of a triangle is known to be complex and lengthy. A new low could easily expand the wave C and hence the entire triangle (small red x). The entire triangle pattern would become invalid if price breaks below the bottom (big red x). For the moment, a bullish breakout and uptrend resumption do seem close by. The Wizz 9 and previous top are the next immediate targets.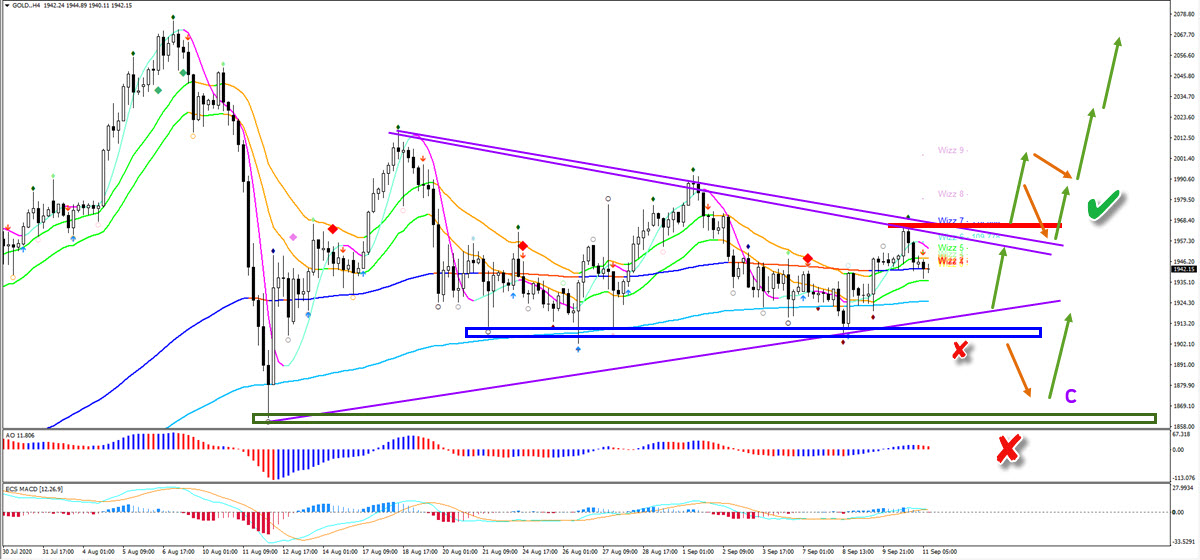
The analysis has been done with the indicators and template from the SWAT method (simple wave analysis and trading). For more daily technical and wave analysis and updates, sign-up to our newsletter.
Good trading,
Chris Svorcik


Leave a Reply