Gold is at Critical Level on Medium Term and Short Term
Subscribe
Dear Trader,
Does the GOLD chart seem confusing? This article will be your guide for analysing the market structure in more depth.
In today’s analysis our focus will be on short and medium term view of the yellow metal.
GOLD is in Medium Term Range (4Hr):
Let us discuss the 4Hr chart first, the structure is a big “W” within a flat range. The support base zone of this range is located at 1204-1214. Whereas the resistance ceiling zone of this range is located at 1293-1300. The price has been rejected previously at the resistance three times and twice at the support zone. On medium term (4Hr chart), price has the choice of either showing a bullish breakout above resistance or continuing the range pattern by bouncing.
The price established bullish and bearish channels previously. We can clearly see from the chart below that the price had respected the resistance and support trend lines of these channels. Once the channel was broken, price reversed in the short term and established counter trend channels. At the moment price is in a bullish channel.
We are using 144 MA in the chart below that clearly provide support to the price in the current bullish channel. And now again it can come it play. Once if this gets a break here, we may see price to travel bearishly towards the support again. If 144 MA provides support again then the flat range breakout may take place.
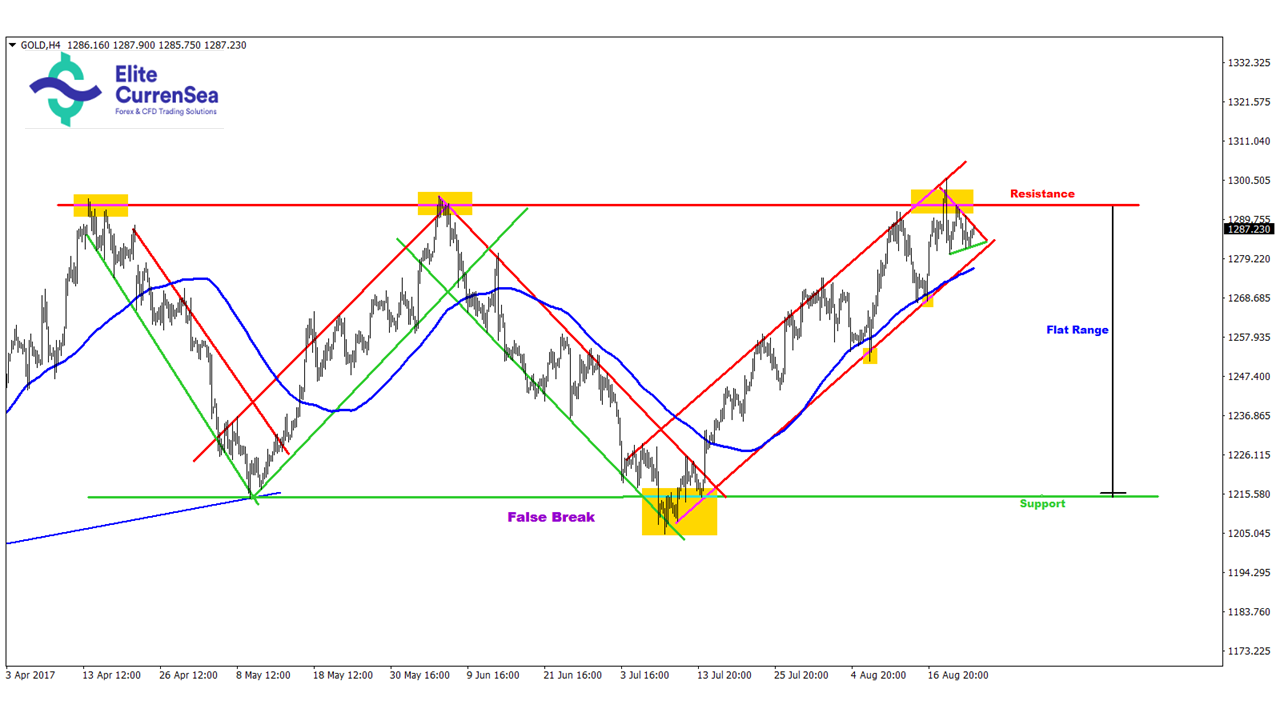 Image 4Hr Chart Gold
GOLD is in Bullish Channel on Short Term (1Hr):
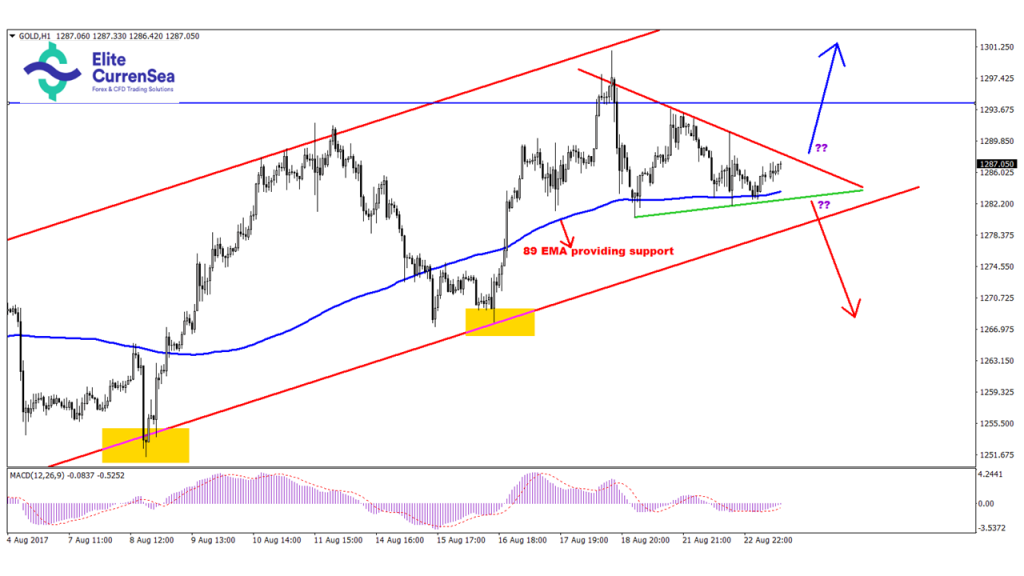
On 1Hr chart, the price is in the bullish channel. The support trend line of this channel has provided support to price action three times in total. Now, if it provides support again then we may see the major resistance break. On the other hand, if the support trend line of this channel breaks then we may see a counter trend channel. In the chart below, we used 89 MA. Price had previously took support on this MA.
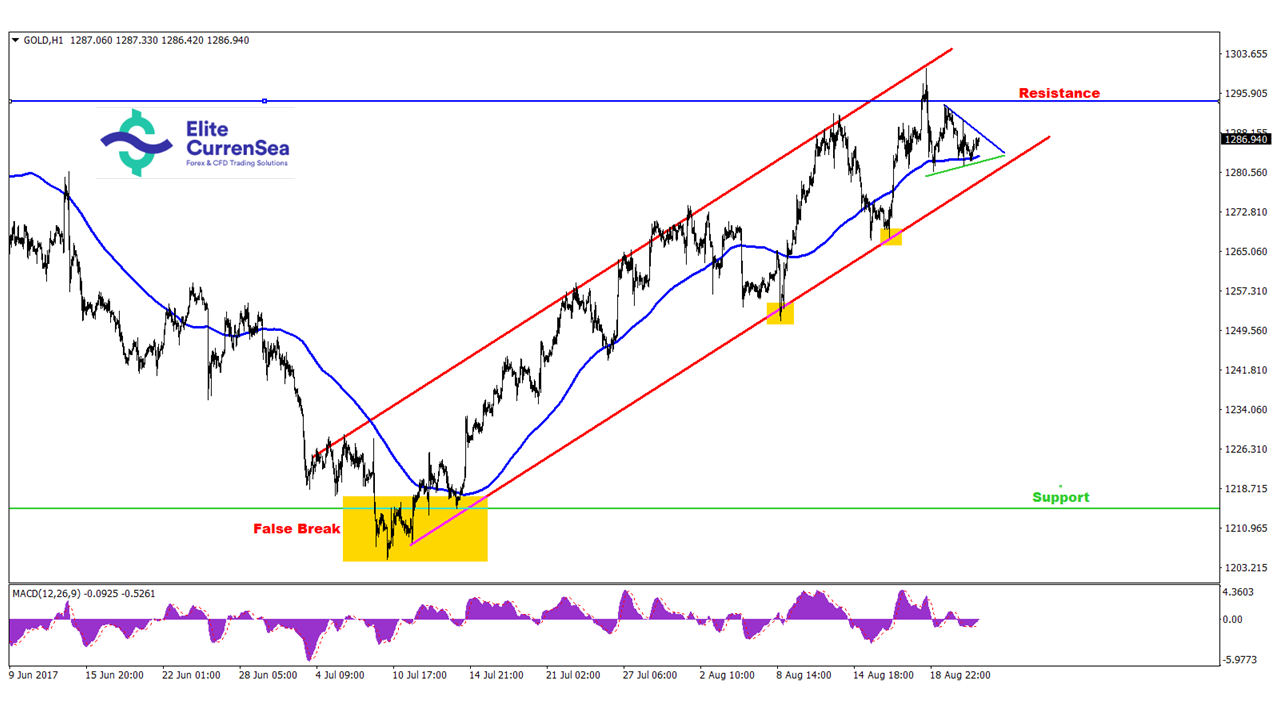 Image 1Hr Chart Gold
Further, we can see the price has made a symmetrical triangle as shown in the chart below. A breakout can happen anytime. The next support is the channel support trend line which if breaks can send price deeper bearishly.
 Image 1Hr Chart Gold
Many green pips,
Elite CurrenSea team
More info on our ecs.SWAT course and trading system
Twitter: @EliteCurrenSea
YouTube: Elite CurrenSea


Leave a Reply