GBP/USD At Critical Level
Subscribe

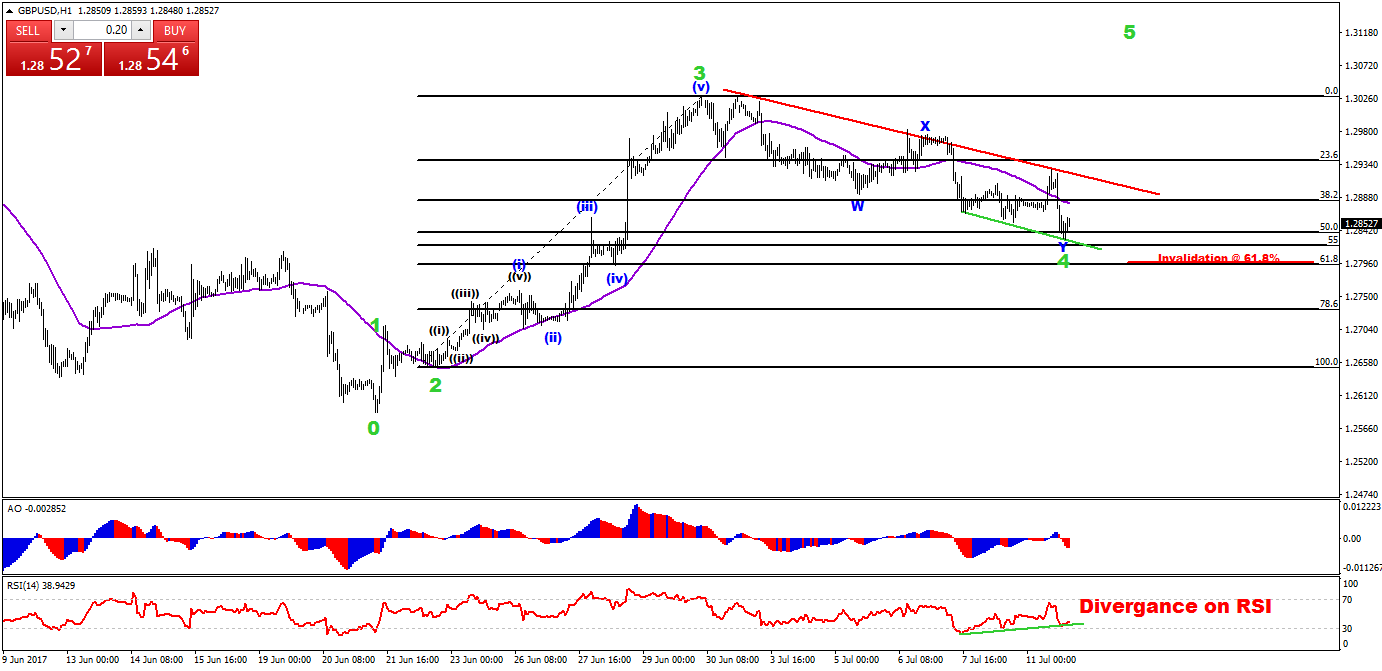
Elliott Wave Scenario:
According to the wave count of the 1 hour GBP/USD chart, the pair has arrived at a critical 50% Fibonacci support level. There is only last credible support remainng which is the 50-61.8% Fib zone. The GBP/USD has just completed the correction phase andit is now ready to go for a potential wave 5 green. The invalidation level of wave 4 green is a break of the 61.8% Fib level. The correction followed a WXY pattern (blue) which could have been completed at the 50-61.8% Fib. The break of the trend line (red) suggests a confirmation of the start for the 5th wave green.
RSI Indicator:
The RSI indicator is currently at level 30 and divergence is visible between the bottoms, as shown in the image below, which suggests the reversal in the bearish momentum. Keep in mind that this divergence is on 1Hr chart that may not be a strong aspect. In short, RSI is suggesting the bullish reversal.
Moving Average:
Price is just hovering below the 55 EMA. We consider a break of the 55 EMA as a strong sign for the start of 5th wave and a break of 55 EMA could support our bullish scenario.
Follow us:
Twitter: @elitecurrensea
Youtube: Elite CurrenSea


Leave a Reply