GBP/JPY Waiting for Reversal or Invalidation
Subscribe

GBP/JPY is in a decisive zone at the moment. To analyse the market, let us discuss the Fibonacci and MACD Divergence perspective in today’s analysis.
Bullish Reversal due to Divergence?
On the 4Hr chart, we have a trend swing (Bullish) and a counter trend swing (Bearish). Now, let us draw the Fibonacci retracement tool from from the low to the top of the trend swing. The price took decent support from 23.6% (145.26) and 38.2%(144.07) retracement levels, showing the validity of the Fibonacci retracement tool mapped on trend swing.
The support zone between 88.6% and 99% is very important and less risky. This zone may also prove to be major support area. The invalidation level is the 100% retracement level present at 138.67.
We can see that a divergence pattern is visible on the MACD Oscillator signaling a potential bullish reversal or retracement ahead.
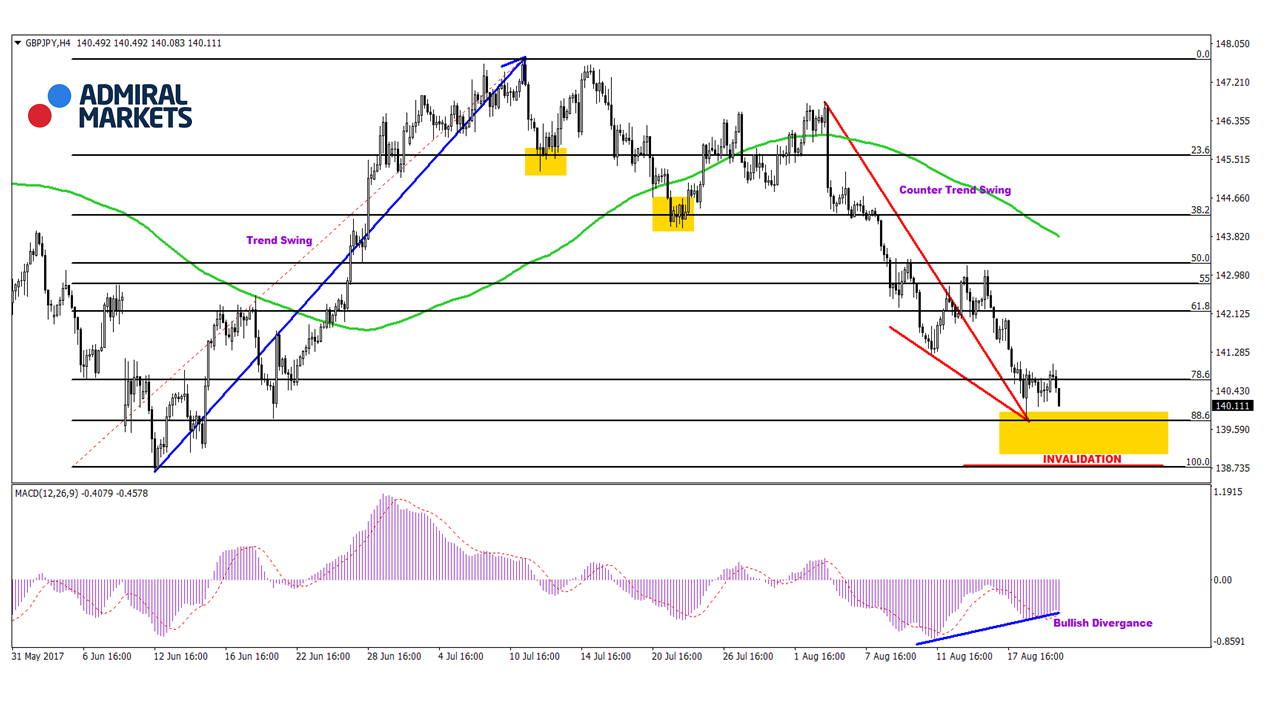
Image 4Hr Chart GBP/JPY
GBP/JPY Bearish Channel is Critical
On the 1 Hour chart, we have a bullish and a bearish channel as shown in the image below.
The break of the trend channel resistance could signal a potential reversal as well.
Price is at a key break spot:
- The GJ will either break the bearish channel and start a bullish impulse or
- The GJ will continue in the downtred channel and make a lower low.
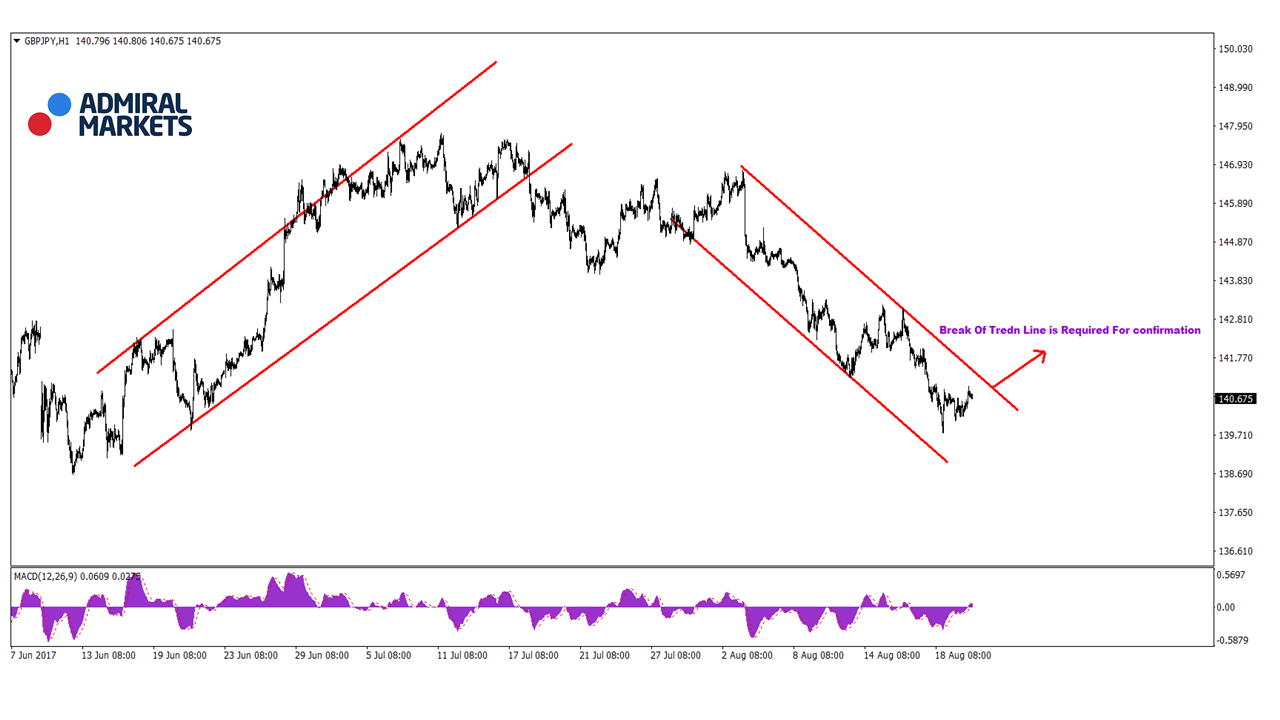
Image 1Hr Chart GBP/JPY
Many green pips,
Elite CurrenSea team
More info on our ecs.SWAT course and trading system
Twitter: @EliteCurrenSea
YouTube: Elite CurrenSea


Leave a Reply