? GBP/USD Triangle Pattern in Impulsive Downtrend Channel ?
Subscribe
Hi traders,
The GBP/USD is testing the resistance trend line (red) of the downtrend channel. A break below the triangle pattern could indicate a downtrend continuation.
GBP/USD
4 hour
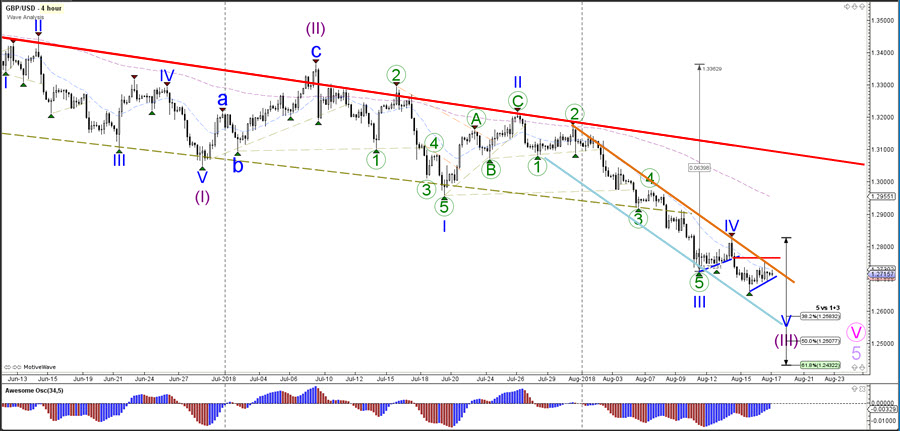
The GBP/USD seems to be building a wave 5 (blue) of wave 3 (purple). A bearish breakout could indicate a fall towards the Fibonacci targets of wave 5 (blue). A break above the channel resistance could indicate a larger correction of either wave 4 blue or purple.
1 hour
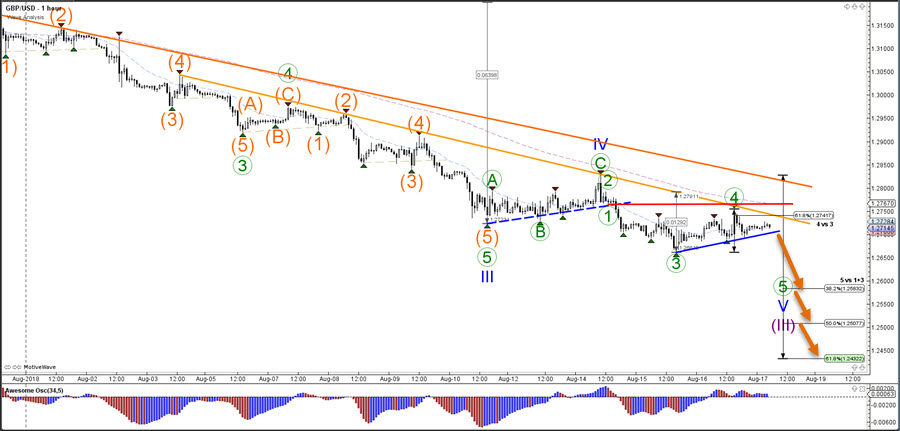
The GBP/USD is still probably in a wave 4 (green) within the wave 5 (blue) because price did not enter into the territory of wave 1 (red line). As long as price stays that level then a 5 wave (green) pattern is possible. A bearish push below the support trend line (blue) indicates the potential breakout.
Good trading,
Chris Svorcik
Elite CurrenSea


Leave a Reply