☝️ GBP/USD Starts Bearish Wave C with Break Below 1.23 ☝️
Subscribe
Hi traders,
the GBP/USD is struggling to break above the 1.24 resistance zone, which could indicate the end of the wave A (blue) and the start of a bearish correction.
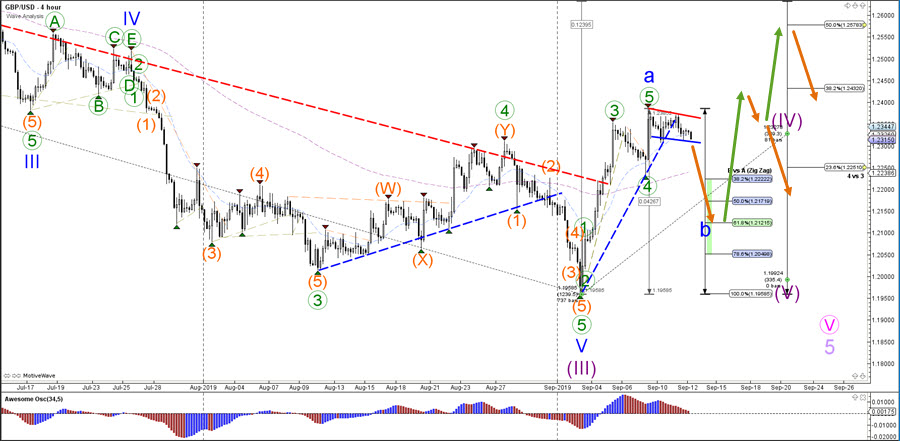
GBP/USD
4 hour
The GBP/USD needs to break below the support trend line (blue) of the bull flag pattern, however, before a larger bearish move can be expected. The target of the downside are the Fibonacci levels of the wave B vs A, because a larger ABC (blue) zigzag pattern seems likely.
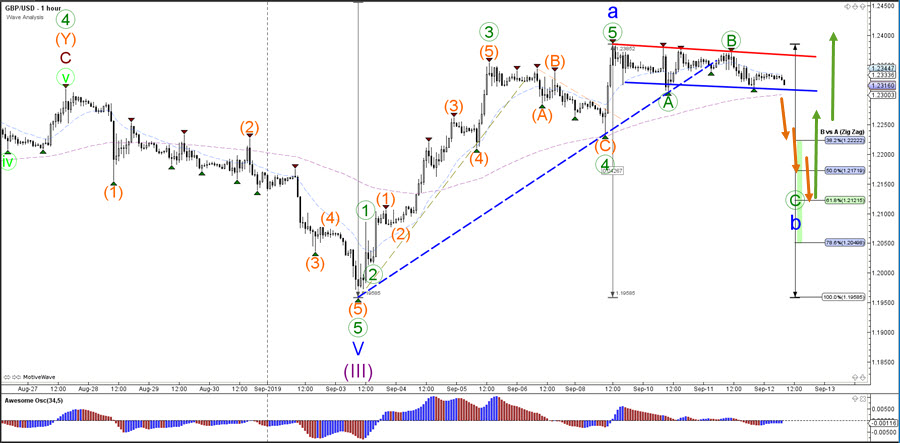
1 hour
The GBP/USD seems to be building a bearish ABC (green) correction within the wave B (blue). A bearish breakout would confirm the start of the wave C (green) whereas a break above the wave B (green) and resistance line (red) of the bull flag channel could indicate more upside and test of the 1.2425-1.25 target area.
For more daily wave analysis and updates, sign-up up to our ecs.LIVE channel.
Good trading,
Chris Svorcik
Elite CurrenSea


Leave a Reply