🔥 GBP/USD Price Swings and Waves Before US Elections 🔥

Dear traders,
the GBP/USD made a bearish reversal at the 61.8% Fibonacci retracement. The uptrend channel is also looking corrective and choppy.
This article explains why the bears are expected to regain control soon – with just weeks left in the final stages of the Brexit development and just before the US Presidential elections.
Price Charts and Technical Analysis
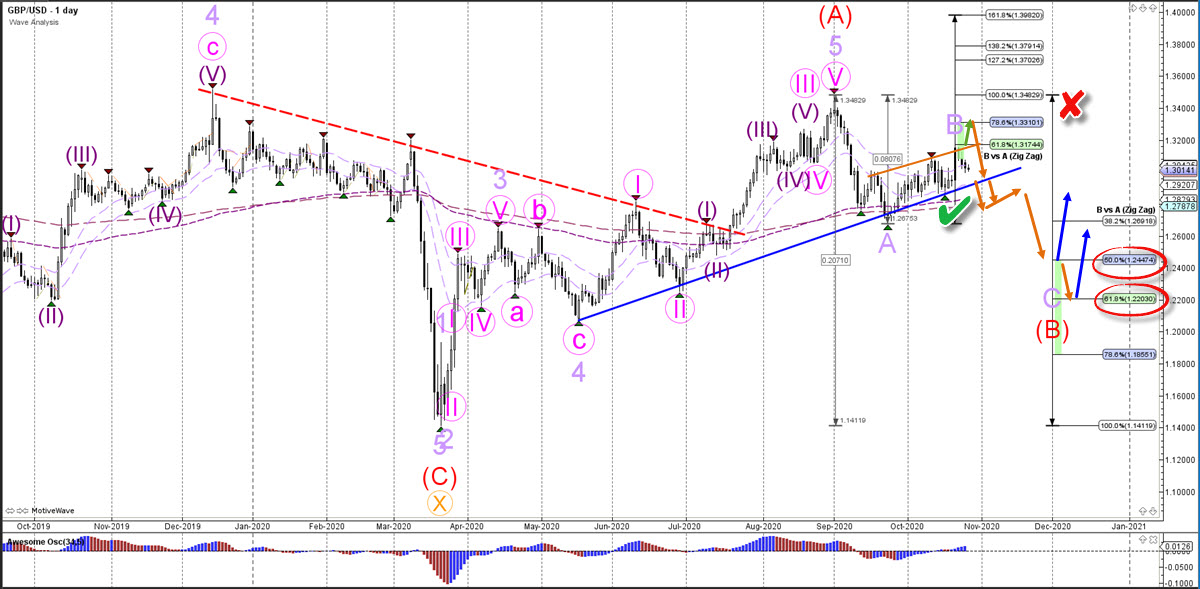
The GBP/USD is expected to turn bearish soon – despite the presence of the uptrend channel. The Cable could find heavy resistance at the 78.6% Fibonacci retracement level – if price action reaches that high. Or the bears could break below the support trend line (blue) for a bearish breakout.
The main targets of the bearish breakout are the 50% and 61.8% Fibonacci retracement levels of wave B vs A (red circles). This price swing could complete a bearish wave C (purple) of a larger wave B (red).
On the 4 hour chart, price action is testing the support trend lines (green) and support zone (blue box) again. This is a critical decision zone for either a bullish bounce or bearish breakout, which seems to be 50-50% at the moment.
A break above the resistance (green arrow) could start one more rally towards the next 78.6% Fib. But a bearish breakout (orange arrows) probably confirms the end of the wave C (pink) in wave B (purple).

The analysis has been done with the indicators and template from the SWAT method (simple wave analysis and trading). For more daily technical and wave analysis and updates, sign-up to our newsletter.
Good trading,
Chris Svorcik


Leave a Reply