? GBP/USD Lengthy Triangle Pattern Awaiting Major Break Soon ?

Dear traders,
the GBP/USD is completing a triangle pattern, which can break in both directions (green checks). The main decision will be made once price is able to break above resistance (red) or below support (blue).
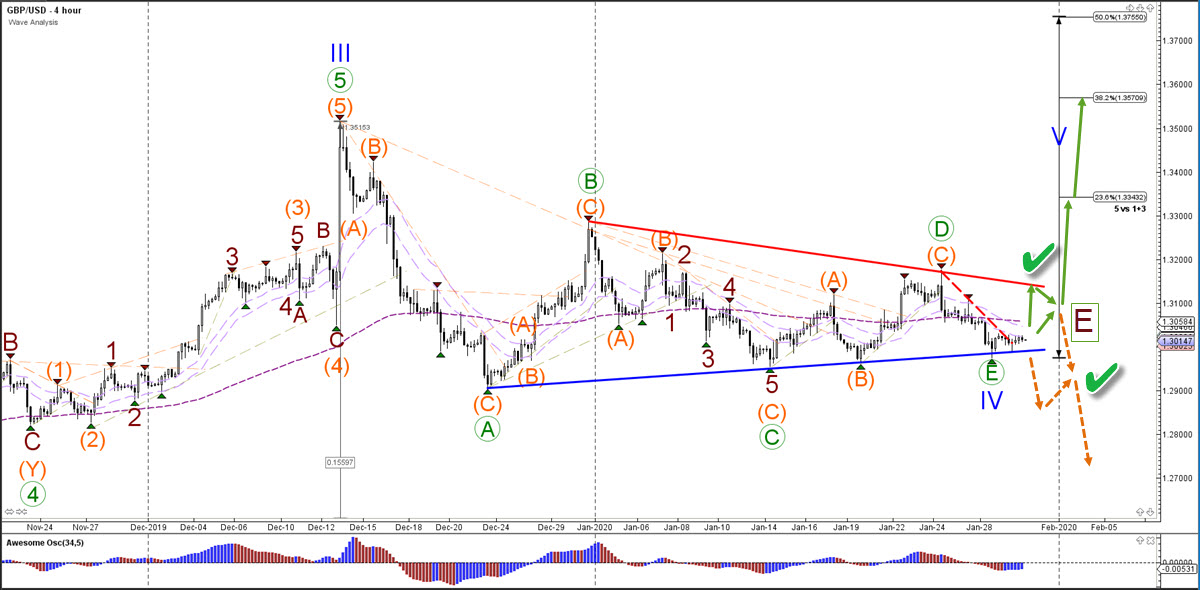
GBP/USD
4 hour
The GBP/USD could be in a bullish triangle. In that case price could have just completed the final wave E (green) pattern. This scenario is confirmed as long as price action stays above the support (blue) and if price action can break above the resistance line (red). The triangle could also be bearish. In that case, a push up could be a wave E (dark red) and price action is expected to push below the support (orange arrows).
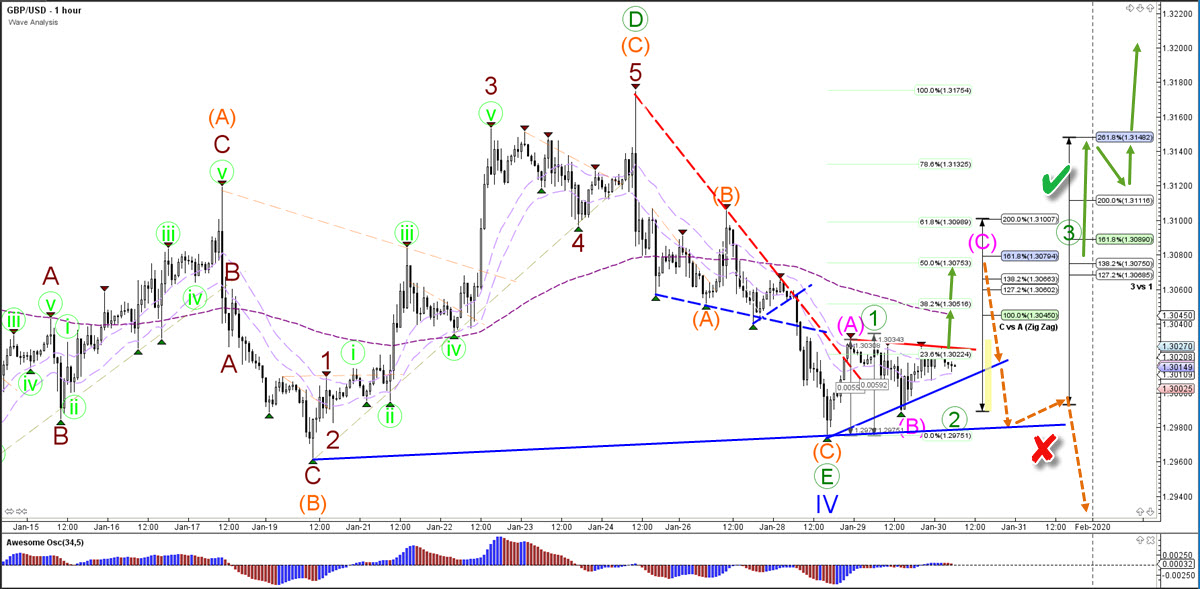
1 hour
The GBP/USD could be building a bullish ABC (pink) if the triangle pattern is bearish or a 123 (green) of the triangle is bullish. A bullish triangle becomes more likely if strong impulsive price action can break above the 61.8% and 161.8% Fibs. A strong bearish bounce, however, and breakout could indicate a bearish triangle and downtrend.
The analysis has been done with SWAT method (simple wave analysis and trading).
For more daily technical and wave analysis and updates, sign-up up to our newsletter.
Good trading,
Chris Svorcik
Elite CurrenSea


Leave a Reply