? GBP/USD Higher High Within Wave-5 Ending Diagonal ?
Subscribe
Hi traders,
the GBP/USD made a bullish bounce at the support trend line (blue) as we expected in our daily analysis for ecs.LIVE. Price rebounced strongly and has now reached the resistance trend line (red) of a rising wedge chart pattern. Ps. do not forget to check out our upcoming 2x Forex seminars on trading in Europe!
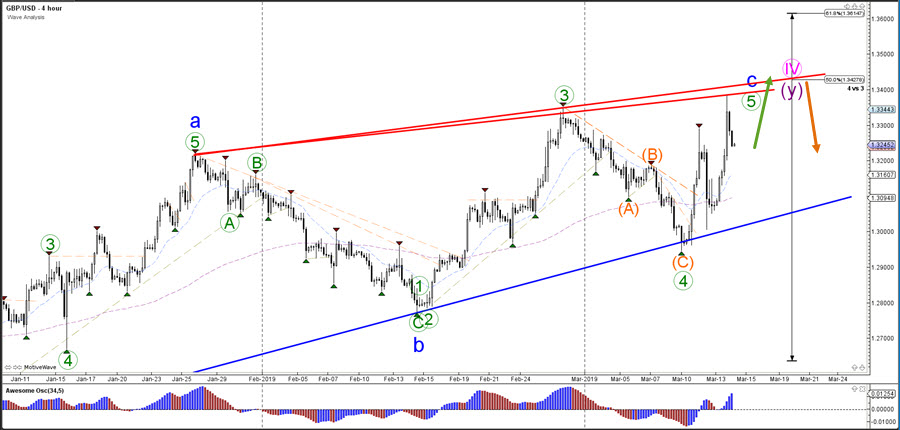
GBP/USD
4 hour
The GBP/USD could make one more push higher towards the 50% Fibonacci retracement level of wave 4 vs 3 (pink), which in turn is expected to be a major decision zone for a bullish break or bearish bounce. The latter scenario is most expected as the ornage arrow indicates. The last push up could complete a wave 5 (green) of wave C (blue). The wave outlook is of course heavily dependent on any and all Brexit related news.
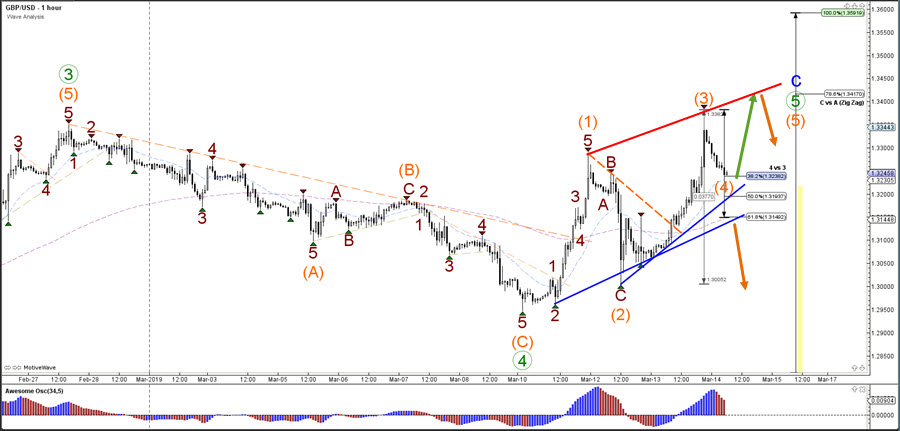
1 hour
The GBP/USD seems to be building an ending diagonal with a potential final wave 5 (orange) remaining. If this wave outlook is correct, then price will use the Fibonacci retracement levels of wave 4 vs 3 for a bullish bounce and one more higher high. A break below the support trend line (blue) and the 61.8% Fibonacci retracement level could indicate a bearish reversal.
For more daily wave analysis and updates, sign-up up to our ecs.LIVE channel.
Good trading,
Chris Svorcik
Elite CurrenSea


Leave a Reply