? GBP/USD Full Steam Ahead with 1.30 Resistance Nearby ?
Subscribe
Dear traders,
the GBP/USD is building a flag chart pattern (red/blue lines), which typically indicates continuation. What is the main target of the uptrend?
GBP/USD
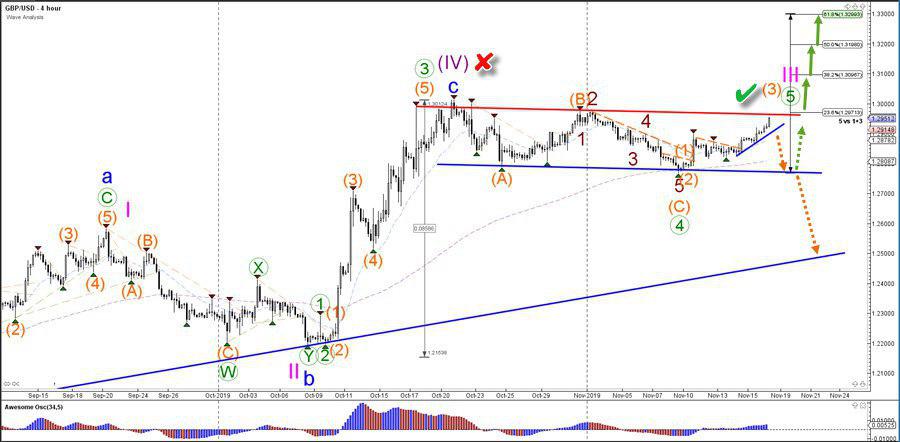
4 hour
The GBP/USD bullish breakout above resistance (red) confirms (green check) the wave 5 (green) of a larger wave 3 (pink). It also invalidates (red x) the old wave 4 (purple) outlook. A bullish break (green arrows) would usually be aiming at the 61.8% Fibonacci target of wave 5 vs 1+3 at 1.3270. The dotted arrows indicate the alternative path of price if a breakout fails.
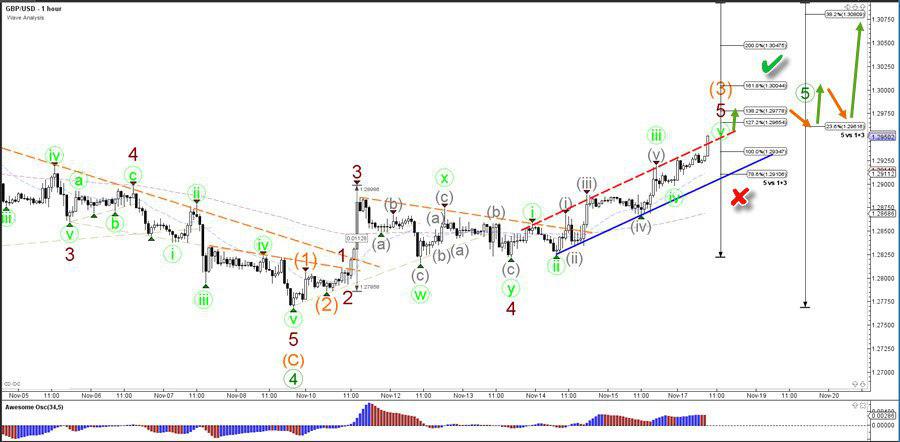
1 hour
The GBP/USD is breaking above the resistance trend line (dotted red) of the uptrend channel. At the moment, the price is likely to test the key resistance level at 1.30, which is a critical decision zone for a bounce or break. A breakout (green arrows) above 1.30 confirms (green check) a full scale uptrend whereas a push below the channel invalidates (red x) impulsive wave outlook.
For more daily wave analysis and updates, sign-up up to our ecs.LIVE channel.
Good trading,
Chris Svorcik
Elite CurrenSea


Leave a Reply