☝️ GBP/USD Bullish Reversal after Bouncing at 50% Fibonacci Support ☝️

Dear traders,
the GBP/USD made a higher low, which could confirm the end of the bearish price swing and wave C (orange). Is the Cable ready for a reversal?
GBP/USD
4 hour
The GBP/USD has been bearish after the break below support (dotted blue). But price action made a bullish bounce at the 50 Fibonacci of wave 4 vs 3. And price also broke above the resistance trend line (dotted red). A break above the channel could confirm (green check) the bullish price swing and reversal.

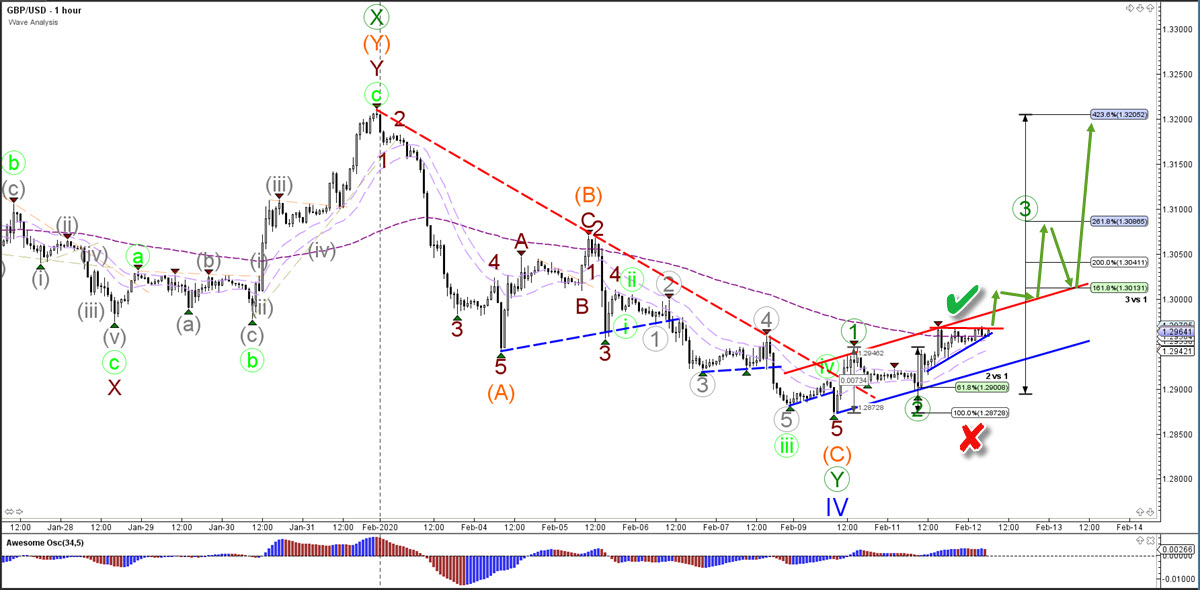
1 hour
The GBP/USD break below the 100% Fib invalidates (red x) the bullish reversal. Price is now building an ascending wedge chart pattern. A bullish break above resistance (red) could confirm (green check) the move up. A key break will also be a push above 1.30.
The analysis has been done with SWAT method (simple wave analysis and trading).
For more daily technical and wave analysis and updates, sign-up up to our newsletter.
Good trading,
Chris Svorcik
Elite CurrenSea


Leave a Reply