? GBP/USD Bullish Momentum Expands Correction to 1.2250 ?
Subscribe
Hi traders,
the GBP/USD made a larger bullish correction as expected after breaking above the resistance trend line (dotted red). The bulls seem to be running out of steam however at the round level of 1.2250.
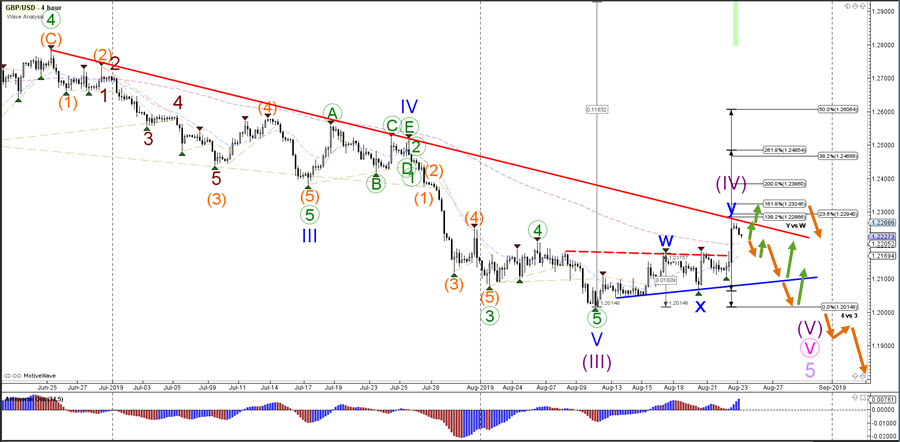
GBP/USD
4 hour
The GBP/USD bullish momentum is also running into a strong resistance 23.6% Fibonacci level and a trend line (red) from the previous tops and larger downtrend. A bearish bounce could indicate the end of the bull move and wave Y (blue). A larger bullish correction within wave 4 (purple) remains possible though if price remains above the support zone (blue) or breaks above the resistance for a push towards the 38.2% Fib.
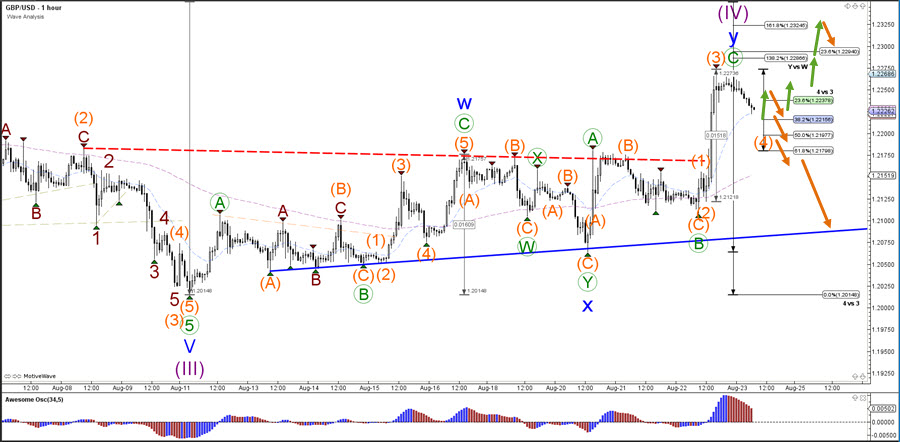
1 hour
The GBP/USD could be building a 5 wave (orange) pattern if price stays above the 50% Fibonacci retracement level of wave 4 vs 3. A break below the 61.8% Fibonacci however makes that pattern unlikely and a larger bearish correction is more probable. Another bullish swing could take place but seems limited to a move into 1.23-1.2350.
For more daily wave analysis and updates, sign-up up to our ecs.LIVE channel.
Good trading,
Chris Svorcik
Elite CurrenSea


Leave a Reply