? GBP/USD Bullish Impulse Challenges 1.30 Resistance Zone ?

Dear traders,
the GBP/USD made a lower high after showing bullish momentum. Can the Cable make one more rally within the range?
GBP/USD
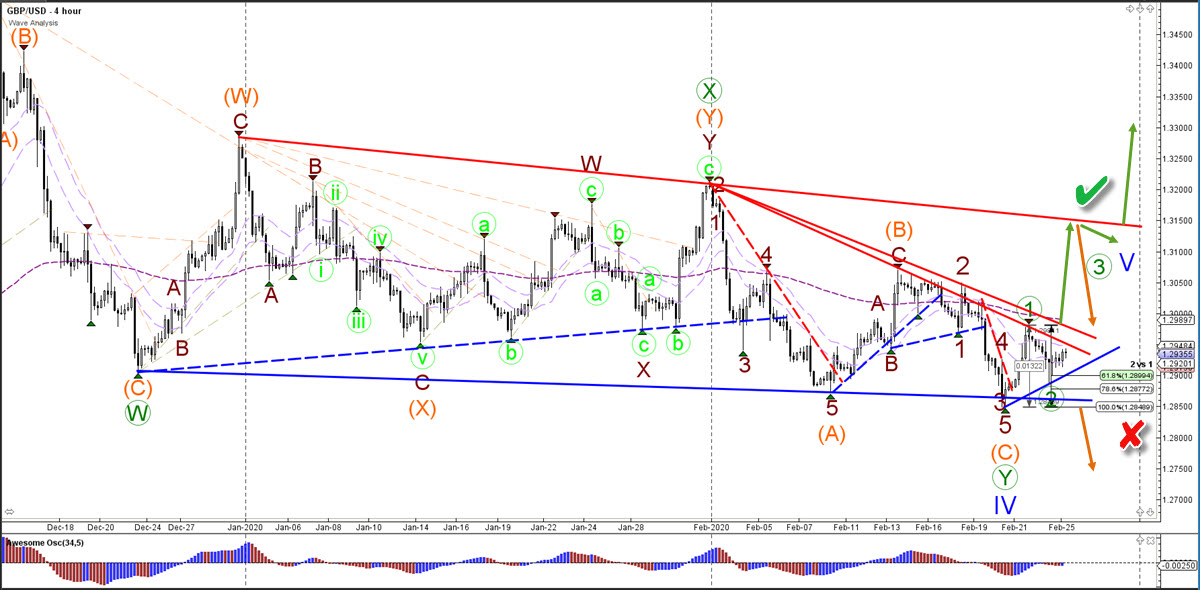
4 hour
The GBP/USD price action remains choppy. The trend lines indicate the lack of a trend. But the bullish impulse could be labelled as a wave 1 (green) after price action completed a potential bearish wave C (orange). This is invalidated (red x) if price is able to break below the 100% Fib level. A break above the resistance levels (red) could indicate a move up to 1.31 or 1.3150 and the next resistance zone (red).
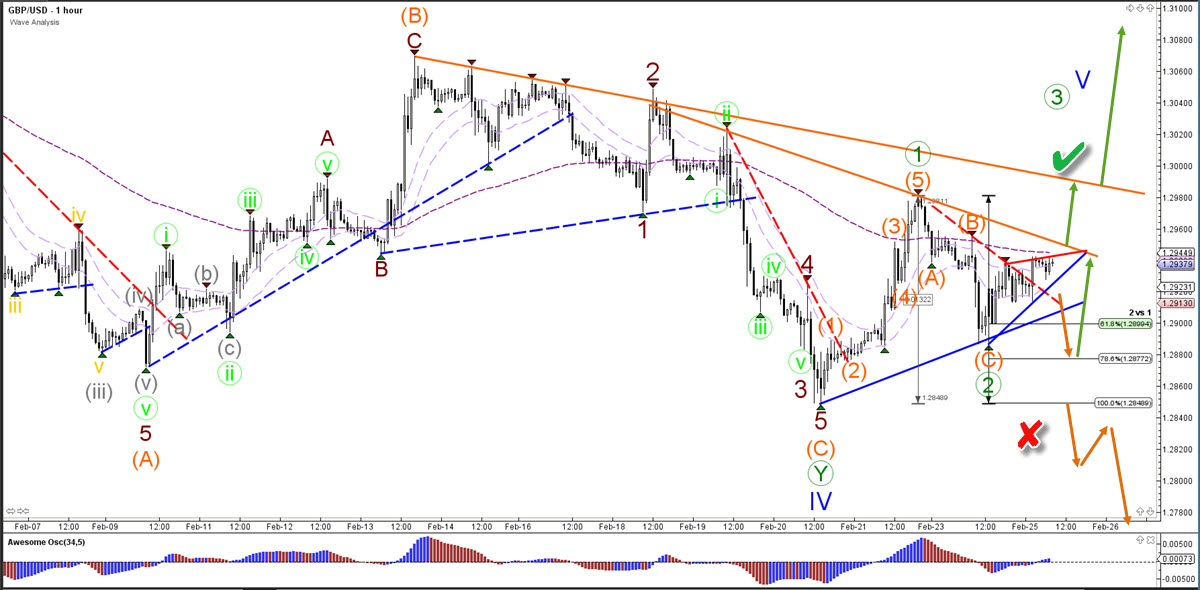
1 hour
The GBP/USD is showing a potential bullish impulse as a wave 1 (green). But the wave pattern can also be a wave A for a larger ABC pattern. The key levels remain the bottom at 1.2850 for a bearish breakout and 1.30 resistance for a bullish breakout.
The analysis has been done with SWAT method (simple wave analysis and trading).
For more daily technical and wave analysis and updates, sign-up up to our newsletter.
Good trading,
Chris Svorcik
Elite CurrenSea


Leave a Reply